
The Best Year for Games 2010-2014
Background
Having just completed the analysis on game quality data to compare Kickstarter published games to the general population of games, some interesting data regarding the general quality of games over time also became available. While the data is available, let’s take a quick look at the quality of Hobby Games over time.
The data presented here was collected from on Board Game Geek using the Advanced Search feature. Please refer to the original article (Kickstarter: A Source for Quality Games?) for the qualifications to this data.
Setup
Many like to argue what year was the best for producing great games, so here’s the data.
Round 1: Game Ranks by Year
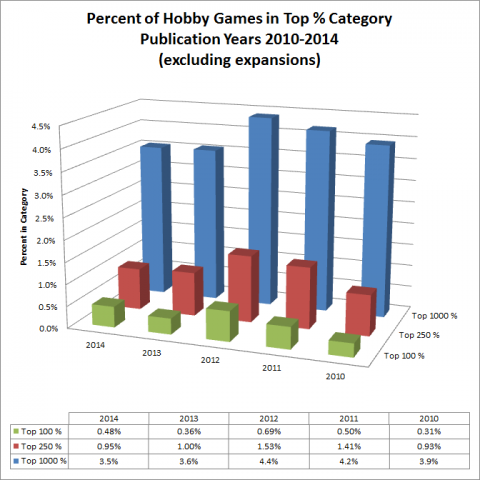
First, as a percentage of games produced.
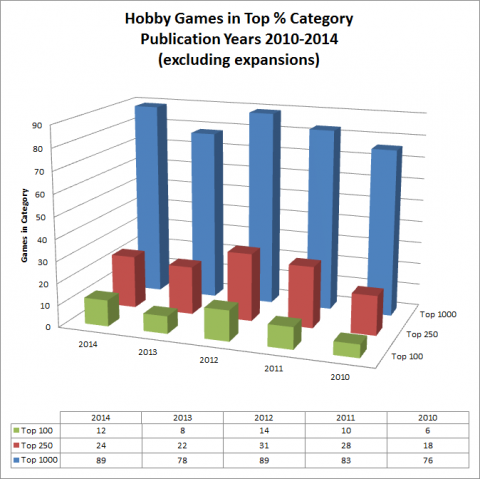
Now, as raw numbers of games.
Round 2: Not Quite So Simple
The data is always changing based on public opinion and, probably most important, access to recently published games. In particular, the ranks of games produced in more recent years will likely continue to rise as more people get to play them, pushing down games from previous years.
Since I started the original article over 4 months ago and I had to pull fresh data to complete the article, I was able to identify the shift that can happen in a short time. This is a lot of data with little explanation, but the chart shows the change in the raw numbers and percentages for games in the top ranks on BGG over the period of about 4 1/2 months.
Based on the increase across all quality categories for 2014 and the rise in quality categories for 2013, I think we can say that the jury is still deliberating on 2014.
In the chart below the % in the black letter rows indicate the increase/decrease in the number of games in the category. The % in the red letter rows indicate the increase/decrease in the percentage of games from that year in the category.
| % Change in Rank Data for All Games (June 30 - Nov 16 2015) | ||||||
|---|---|---|---|---|---|---|
| Year | 2014 | 2013 | 2012 | 2011 | 2010 | Total/Avg |
| Total | 2.8% | 1.7% | 1.3% | 0.1% | 0.5% | 1.3% |
| Top 10000 | 12.1% | 4.9% | 0.2% | -0.7% | 0.0% | 3.2% |
| Top 10000 % | 9.1% | 3.2% | -1.1% | -0.8% | -0.5% | 1.9% |
| Top 5000 | 5.0% | -2.7% | -2.5% | -3.5% | -3.4% | -1.4% |
| Top 5000 % | 2.1% | -4.3% | -3.7% | -3.6% | -3.9% | -2.7% |
| Top 2500 | 14.4% | -0.5% | -3.0% | -1.7% | -4.6% | 0.8% |
| Top 2500 % | 11.2% | -2.2% | -4.2% | -1.8% | -5.1% | -0.5% |
| Top 1000 | 9.9% | 3.9% | -7.4% | -40.7% | -1.3% | -7.7% |
| Top 1000 % | 6.9% | 2.2% | -8.5% | -40.8% | -1.8% | -8.9% |
| Top 250 | 9.1% | 4.8% | -6.1% | -3.4% | -26.3% | -4.0% |
| Top 250 % | 6.1% | 3.0% | -7.2% | -3.6% | -26.7% | -5.3% |
| Top 100 | 20.0% | 14.3% | 0.0% | 0.0% | -14.3% | 4.2% |
| Top 100 % | 16.7% | 12.4% | -1.2% | -0.1% | -14.7% | 2.8% |
End Game
There is not a significant difference from year to year, but it appears that 2012 is the clear winner both in raw number of games and percentage of games produced. However, as more people play 2014 production year games, the average rank of these games will continue to rise. Certainly 2014 will eclipse 2012 on raw number of quality games, but it has a long way to go to beat 2012 out on percentage of games.
Since everyone has their own sense as to what makes a good game and has been exposed to a unique and small subset of all games, individuals will likely see a different year as the producer of the best games.
Your Turn
How does the data compare to your perception of the best year for games? How long does it generally take you to play and rate a popular new game?