Industry Analysis
Although the expertise and focus of Opie Games is not to analyze the game publishing industry, as we design and develop games we are considering the current marketplace when deciding which game designs to pursue. Time to design is always a limiting factor, if not the most limiting, so working on something for which the market is quickly diminishing or is over-crowded may be equally wasted. These studies may also be helpful in providing information for a pitch, to differentiate what Opie Games has designed from what is available. How this information is not being use is to determine what game to start thinking about. Ideation is upstream of this process.
Objective
Survey and analyze (to the extent reasonably possible) the game publishing industry to:
- Inform the Opie Games process decisions from design into development.
- Become knowledgeable about the game publishing aspect of the table top game industry.
- Identify game publishing trends to forecast the market needs of the near term future.
- Provide the game design and development community information that maybe helpful on its own or may seed further analysis.
Hopefully, you will find this analysis interesting and helpful in your own forays into the game publishing industry.
Hobby Game Trends 2000-2014: Introduction
Introduction
The card and board game design and publishing industry has been growing rapidly in recent years. Some might call it a boom, some might worry that it is a bubble, and some optimists (like me) say it is only the beginning. Beyond the sheer quantity of cardboard distributed, the number of new releases is also rising and some argue that the general quality of design and production is improving; they suggest that we are in the “Golden Years” of game design.
Without casting aspersions, much of the discussion regarding the industry, though, is anecdotal and relies heavily on speculation. Exactly what is happening to the hobby as an industry is difficult to gauge due to the lack of public information about specific distribution and dollars figures. Many of the companies involved in what might be described as the most dynamic sector (hobby games) are small and privately held. Others are large, international organizations for which the tiny hobby game sector is a small segment of their operations.
Fortunately, there is some public information available and thankfully, there is a ton of information held in the Board Game Geek database that can be gleaned (and cleaned) for this purpose.
What started as an inquiry into a specific category of games for the purpose of testing the originality of a “new” concept quickly grew into a much broader survey of the industry. What started as, “What’s happening now?” quickly expanded to “What trends are impacting the now?” This series of posts will walk through various aspects of the industry from 2000 to 2014 and peek at what has been targeted for 2015.
An important note: I am publishing this information as it becomes available to me and as I can digest it. (This is not a completed work). The designation "Notebook" is intended to convey this fact. Further, think of this notebook as a wiki where not only will new articles be posted, but existing articles will be edited, refined, and improved upon over time. If this information is interesting to you, please let me know so I can alert you to changes. I will use the Design Blog with the Game Industry tag to summarize updates. I will only make a few observations of the data as it interests me, but provide it here for your own discovery.
The Rules
First, a huge shout-out is due to Board Game Geek for maintaining a wealth of data which is the primary source used in this analysis.
Second, some caveats:
- At this point I am using the public interface to the BGG database to query the data, which is limited and requires a slow, inelegant process to collect and consolidate.
- At times an analysis of the BGG database itself is critical to understanding any analysis of the market.
- I will make note of the limitations, assumptions, and estimates required of the data within each section, but a general statement about data quality and access is in order.
- The BGG database is a treasure trove of data, but it has changed over time and is not maintained to a degree of consistency and accuracy required for deep analysis.
- Some of the data populations are very small, which can introduce error that cannot be tested out.
- The data presented here was obtained through the Advanced Search interface. There is an API available for easier searching, but it is also limited in the query parameters allowed and the results returned.
- Ultimately, the analysis is necessarily high-level.
- Although I am very analytical by nature, I am not a market analyst by trade and I haven’t been required to know much about statistics since college (at which time I was also required to own and know how to use a slide rule).
- Since I am posting this information quasi-live, there may be discoveries later that alter earlier analysis and conclusions.
If there is enough interest in this information, I may inquire with BGG for further access to delve deeper and tidy up the whole study into something more formal. This is your chance to ask questions that may drive the discovery.
Enough with the rules already… Let’s play!
Hobby Game Trends 2000-2014 Round 1: Game Publishers
Publishing Companies
A study of the hobby game market should naturally start with an analysis of the companies publishing hobby games. Given the lack of public information about publishers and distribution volumes previously described I can at best provide a survey and more speculation to add to what is already available.
At a Glance
The big news of 2012-2013 was the increasing number of Kickstarter marketed card and board games by individuals and small companies. That was followed in 2013-2014 with the increasing number of large game companies (in hobby game company size terms) using Kickstarter in what is commonly recognized as a pre-order system. The big news in mid 2014 was the expansion of Asmodee through the, as reported), acquisition of Days of Wonder and the merger with Fantasy Flight Games.
The Data
A significant complication to understanding the activities of game publishers is that most games have multiple publishers at the same time for different markets internationally and several over their lifetime in any given market. There is not enough specificity in the BGG data or likely in any public source to attribute game releases over the last 15 years across the world.
A series of events in the last couple years indicates a growing global market and greater attention to the North American market by European companies. European publishers are exercising a greater presence in US trade shows and US companies are aggressively seeking international cooperative distribution agreements.
Conclusions
Unfortunately, this section of the analysis is quite weak, but it is placed here to demonstrate that it was not forgotten and to identify the issues in reporting on it. The intent is to provide further analysis when data is available. Until then, I’ll conclude with the following observation.
Without providing data to support this statement: It is not uncommon for an industry to see consolidation at the high end (large companies) at the same time and possibly resulting from an explosion of entrepreneurship at the low end. Music and video content producers went through this with the explosion of YouTube and other outlets for user generated content in the last decade. Consolidation and mutual operating agreements of larger game publishers and launches and growth of the smallest publishers will both likely continue through 2015.
Hobby Game Trends 2000-2014 Round 2: Game Releases
Annual New Releases
Before we can begin evaluating any particular subset of games released (by category, genre, mechanic, etc.), we first need to establish a baseline for total games released.
At a Glance
It is no secret that the number of games released annually is increasing. Every measure I have heard is increasing - the number of games released: at Essen Spiel, at Gen Con, through Kickstarter, etc. So this analysis may not provide any surprises or insights, but is necessary to establish the baseline for all other release statistics.
The desire here is to focus on the “hobby games” industry, but in the BGG database differentiating the data for mass market games vs. hobby games is not direct. Ultimately, I can narrow my focus in some ways, but not others. Hopefully, the end result is indicative of the market I am trying to represent.
The Data
All Games
First, a look at all (as recorded in BGG) games released in the years 2000-2014. These numbers include expansions and promos – if there is a record in BGG, it is included – which may bias the data. Since I am concentrating on trends over what has happened in a particular year, I will also present a 3-year running average here and will use this method for most comparisons.
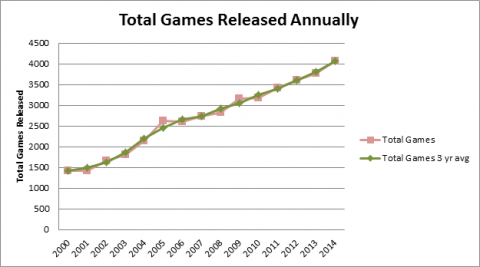
The increase in the number of games released appears to be fairly linear over the entire range, but particularly over the last 7 years.
Hobby Games
As stated, the object of this analysis is “hobby games,” but the ability to focus on this market is limited. So, a few specific game categories that are fairly exact will be eliminated from the data while a greater volume of games will have to remain due to their inexact classification. Note: A complete survey of the BGG categorization of games follows in another article.
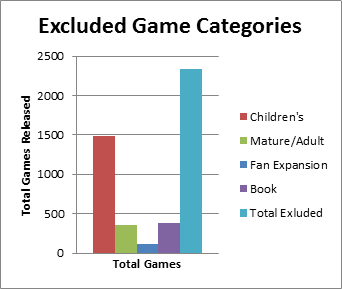
Please don’t think less of me, but I will combine Children’s games and Mature/Adult games into the category of games that can be removed from this study. I am sure that Children’s games will make a very interesting study, but it is not my current focus. Also removed from the data are “Books” and “Fan Expansions” categories which don’t really represent published games. Combined, these categories represent a small percentage of the total games, so the improvement to the data is also small. However, several of the categories intended to study are even smaller. Of games released 2000-2014, these are the numbers:
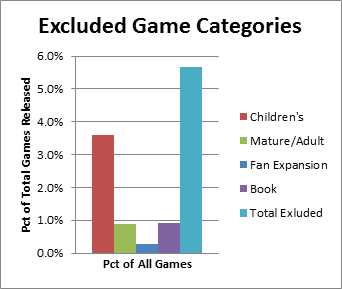
“But wait!” you say, “What about Cards Against Humanity?” Yes, excluding the Mature/Adult category removes Cards Against Humanity from the data and 29 other BGG ranked games. The other 328 games that are eliminated are, shall we say, lesser known. In general these games are not in the Hobby Games class.
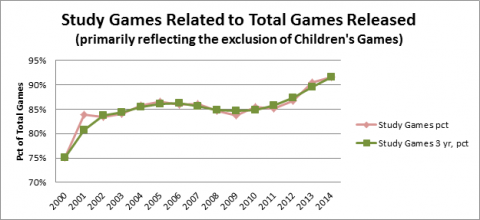
Eliminating these categories produces the illustrated trend. The trend for what I will call the Study Games is not greatly different from the trend for all games, but there appears to be a steeper rise in new games in recent years which may be significant.
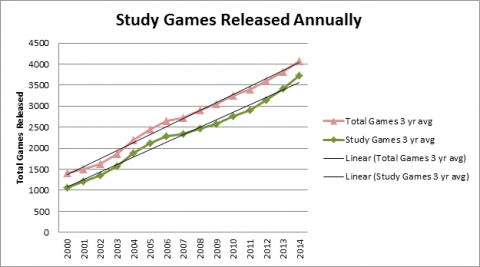
Looking at the difference in the two trends is enlightening. The percentage of non-Children’s games released has increased significantly (from 75% to 92%) over the last 15 years. Though, the increase has not come linearly. A sharp increase in the early 2000’s was followed by a period of relative stability or slight decline, then followed by another sharp increase. Is the trend going to cycle again or is it now on a clear, continual upward path? The actual data for 2014 indicates that the curve may be flattening again, but one point does not a trend make. With the percentage already at 92% however, there is not much more room for growth.
Note: The difference is measured between the actual data for each year then the 3 year average is calculated from the result.
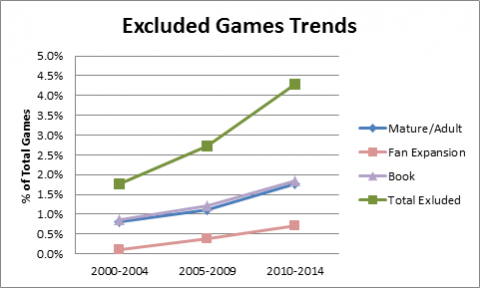
Without providing detailed numbers here are some thoughts. Fan Expansions, Books, and Mature/Adult game releases all have increased over the last 15 years and increased faster as a percentage of all games released in recent years. Excluding them would tend to drive down the recent increase for the Study Games list. Since 64% of the games removed from the study are Children’s games, and the other excluded games have increased, new Children’s games releases have probably declined. There may be an interesting study regarding the trends for those games. Unfortunately, “Children’s Games” in BGG is spread out over a Category and a Subdomain that overlap partially making analysis more complicated and effort than desired at this point.
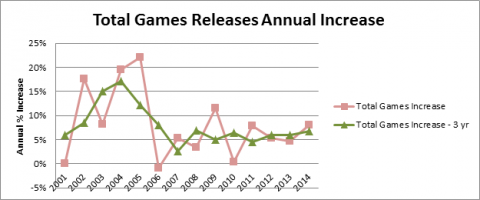
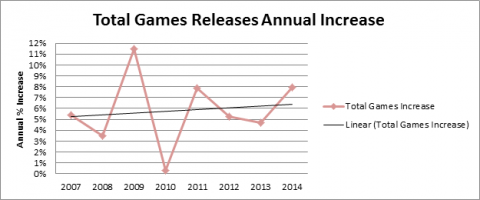
Turning to the rate of increase in games releases, the data is striking. There appears to have been a boom in the early 2000s followed by a reset in 2006 with the years since being fairly flat.
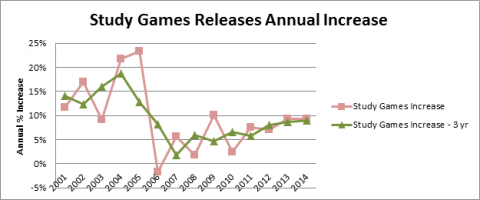
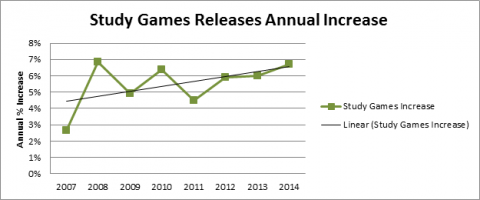
The trend for the Study Games is very similar with the rise over the last few years still evident. In both sets of data there is only one year, 2006, where the rate of increase dropped below 0 (the rate of releases actually decreased) and this was small.
The average increase in growth rate for all games from 2007 to 2014 was from about 5.4% to about 6.2% - a growth rate increase of about 0.1% per year.
The average increase in growth rate for the Study Games from 2007 to 2014 was from about 4.4% to about 6.6% - a growth rate increase of about 0.2% per year.
2015 Games Announced
Although at the time this data was acquired in early January 2015, taking a peek at games already listed as 2015 publications provides some insight into the data. The database likely includes a date when the record was created, but that data is not available through the search engine. The data collected to demonstrate what can be derived from forecasting game releases is dependent on research that has not been released yet, so I will revisit this in the near future.
Conclusions
All Games Releases
It comes as no surprise that the number of games released each year has been increasing every year. What may come as a surprise is that the rate of increase is fairly flat for the last 8 years. Anecdotal accounts indicate that the rate has been increasing significantly in the last few years. The Study Games trend shows at least a slight rise in recent years, but neither indicates that the industry is on the leading edge of a boom.
Hobby Games Releases
While I am primarily interested in “Hobby Games,” I will try to be specific when I think I am getting closer to that specific class of games. I will usually refer to this list as the Study Games since unfortunately I cannot be so specific. Even so, the increase of Study Games (non-Children’s Games) as a percentage of total games released indicates an increase in the releases of Hobby Games over the last 15 years and at an increasing rate in the last 4 years.
If the Study Games can be assumed to represent Hobby Games, there are a few trends worth noting. As with all games, Hobby Games are increasing in production but at a higher rate than the industry over all. Although there are many new sources for games releases (small publishers and Kickstarter) the total new games being introduced is increasing at a fairly flat rate.
New Game Announcements and Projections
Although the data has not been represented yet, it is important to report the following at this point. The 2015 data indicates that on BGG hobby games are announced and records are generally created as soon as they meet the BGG qualifications while mass market games are recorded after they are in market as a matter of historical accuracy. This difference in documentation methods may skew data for recent years; some hobby games projected for 2014 release may not have made it into market and recently released mass market games may not have been recorded. The best correction I can propose is to compare statistics gathered in 2014 with those gathered at the same time in 2015 and 2016 for comparison. So we will have to wait for that analysis.
Hobby Game Trends 2000-2014 Round 3: Game Categories
Categories and Classifications
A very common and expected next step in a market analysis is to classify and categorize the data to make comparisons.
At a Glance
Breaking down the release data by game category seems like a relatively simple process, but it gets sticky quickly.
Let’s start with what seems like a simple question, “What game categories are you interested in analyzing?” This is where I started this whole discovery process. I wanted to analyze a category of games often called “Social Deduction” games; specifically ones that implement the mechanics of “hidden identities/factions” and “hidden objectives.” Neither of those categories exists on BGG. Let’s take a look at some of the categorization challenges and what we have available for categorization (short of categorizing thousands of records myself).
The Data
BGG categorizes games by several criteria that are loosely based on the following four classifications:
- Subdomain: This is presumably a base classification (since there are only a few options), but it overlaps considerably with Category.
- It is noteworthy that this classification is maintained by BGG users through voting and therefore, not all games are assigned a Subdomain.
- Category: This is a loose classification based on genre, intended audience, source, principal components, etc. and overlaps considerably with Subdomain.
- All games appear to have at least one Category and usually several.
- Mechanic: Obviously, the mechanics in the game. This is what I consider to be the “purest” category of the four.
- Unfortunately, not all games have a Mechanic assigned.
- Family: This is another loose classification to indicate a family of games that are associated together through any of a number of criteria including: Intellectual Property, Game Series or Expansions, Mechanics, Genre, etc.
- Many games do not have a Family assigned.
- There is no means within the BGG Advanced Search functionality to compile a complete list nor to designate or filter on Family.
Without getting too linguistically technical, one of the main problems in analyzing this data is that the established categories cross classes. Due to the limited number of designators (4), those designations are overloaded. Another difficulty is the ambiguous or unexpected use of the terms within a category.
An Example
An example that may help illustrate the challenge in dissecting this data is described here.
Let’s say we want to exclude “lone-guy crap-games” like ones maybe I’d publish myself (geez, I hope not). A Publisher of “(Self Published)” indicates the obvious and a Category of “Print & Play” should do the trick, right? Not so fast. Each indicates a game that has ever been self-published or ever had a PnP version and both are assigned to the production version record for the game. “(Self Published)” gets you games as trivial as Twilight Struggle and a total of just over 2600 games in 2000-2014. “Print & Play” returns BattleCON: War of Indines and several Kickstarter games that have done quite well (a total of almost 3400 games in 2000-2014).
Combining the two criteria narrows the list to about 600 total games, 516 within the Study Games, and once again Cards Against Humanity is right there near the top. This list has only 34 rated games in it, so it looks like an opportunity to eliminate some obscure games from the list. However, since this list is compiled through a negative test, it would have to be removed from the Study Games manually year by year. What a pain, but it might be worth the effort.
One can guess that with the decreased cost of home printing there would be a trend here worth noting, i.e., there could be value in excluding them. It could also be wasted effort if the trend for the games on this list matches the trend for all games, then it is just background noise.
Ultimately I have left them in the Study Games and will report on some interesting trends within them in a separate article. Hopefully, this gives you a sense of the challenge.
The Categories
Although there has been much debate on BGG forums about suggested alternate categories, these are what are currently available.
Note: The terms in red are the categories that were excluded from this study.
|
Subdomain |
||
|
Abstract Games |
Children's Games |
Customizable Games |
|
Family Games |
Party Games |
Strategy Games |
|
Thematic Games |
Wargames |
|
|
Category |
||
|
Abstract Strategy |
Action / Dexterity |
Adventure |
|
Age of Reason |
American Civil War |
American Indian Wars |
|
American Revolutionary War |
American West |
Ancient |
|
Animals |
Arabian |
Aviation / Flight |
|
Bluffing |
Book |
Card Game |
|
Children's Game |
City Building |
Civil War |
|
Civilization |
Collectible Components |
Comic Book / Strip |
|
Deduction |
Dice |
Economic |
|
Educational |
Electronic |
Environmental |
|
Expansion for Base-game |
Exploration |
Fan Expansion |
|
Fantasy |
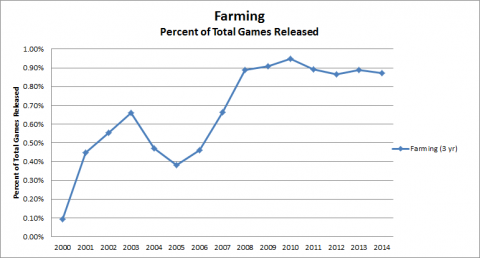
Farming |
Fighting |
|
Game System |
Horror |
Humor |
|
Industry / Manufacturing |
Korean War |
Mafia |
|
Math |
Mature / Adult |
Maze |
|
Medical |
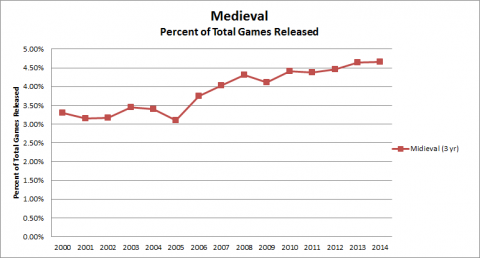
Medieval |
Memory |
|
Miniatures |
Modern Warfare |
Movies / TV / Radio theme |
|
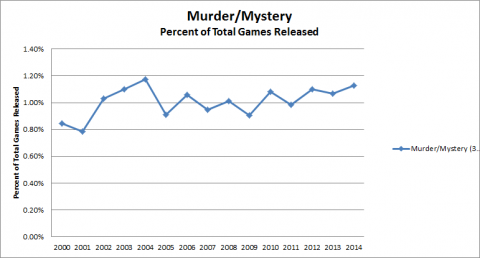
Murder/Mystery |
Music |
Mythology |
|
Napoleonic |
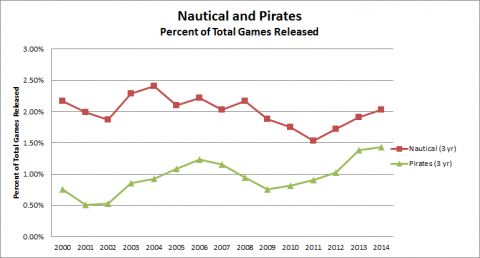
Nautical |
Negotiation |
|
Novel-based |
Number |
Party Game |
|
Pike and Shot |
Pirates |
Political |
|
Post-Napoleonic |
Prehistoric |
Print & Play |
|
Puzzle |
Racing |
Real-time |
|
Religious |
Renaissance |
Science Fiction |
|
Space Exploration |
Spies/Secret Agents |
Sports |
|
Territory Building |
Trains |
Transportation |
|
Travel |
Trivia |
Video Game Theme |
|
Vietnam War |
Wargame |
Word Game |
|
World War I |
World War II |
Zombies |
|
Mechanic |
||
|
Acting |
Action / Movement Programming |
Action Point Allowance System |
|
Area Control / Area Influence |
Area Enclosure |
Area Movement |
|
Area-Impulse |
Auction/Bidding |
Betting/Wagering |
|
Campaign / Battle Card Driven |
Card Drafting |
Chit-Pull System |
|
Co-operative Play |
Commodity Speculation |
Crayon Rail System |
|
Deck / Pool Building |
Dice Rolling |
Grid Movement |
|
Hand Management |
Hex-and-Counter |
Line Drawing |
|
Memory |
Modular Board |
Paper-and-Pencil |
|
Partnerships |
Pattern Building |
Pattern Recognition |
|
Pick-up and Deliver |
Player Elimination |
Point to Point Movement |
|
Press Your Luck |
Rock-Paper-Scissors |
Role Playing |
|
Roll / Spin and Move |
Route/Network Building |
Secret Unit Deployment |
|
Set Collection |
Simulation |
Simultaneous Action Selection |
|
Singing |
Stock Holding |
Storytelling |
|
Take That |
Tile Placement |
Time Track |
|
Trading |
Trick-taking |
Variable Phase Order |
|
Variable Player Powers |
Voting |
Worker Placement |
Conclusions
As mentioned several times, the data available on BGG through Advanced Search is problematic. However, it is also a rich data set that can be used to derive trend information for the game industry as a whole and for specific categories of games. The analyst must be careful in dissecting and assembling this data.
Hobby Game Trends 2000-2014 Round 4: Expansions
Categories Focus: Expansions
As with fans of the movie or TV industry (one I am most familiar with), in the game publishing industry it is common to hear from consumers, “They don’t make anything new anymore. They just keep making serials/add-ons/expansions.” Is there any truth to that sentiment? Before we get into some deeper analysis of specific game categories, let’s take a look at expansions.
At a Glance
Fortunately, BGG has an indicator on a game record identifying it as an expansion. Unfortunately, like so many other factors of interest, this identifier is not available in the advanced search in a way that allows us to search for all expansions. Instead there is a means to filter expansions out – to return a list of games that has no expansions in it. This meets the common request of gamers to list base games, but makes this study more difficult. The only way to get at the number of expansions is to exclude them from the list and take the difference between the two numbers (total Study Games – Study Games that aren’t Expansions = Study Games that are Expansions.) I am expecting some error to be introduced, but hopefully it is minor.

The Data
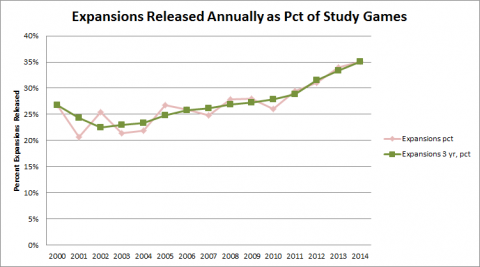
Despite the indirect method of obtaining the data for expansions, there appears to be a very consistent trend revealed. Similar to all Study Games, the number of releases has been steadily increasing over the last 15 years.
Now to address the criticism that the percentage of releases that are expansions is increasing, we compare Expansions within the Study Games to all Study Games. Although the percentage of releases that were expansions decreased significantly between 2000 and 2002, it has been steadily increasing for the last 13 years; passing its 2000 high of 27% in 2008. In 2014 the percentage of game releases that were expansions was a whopping 35%; a rise of 13% in the last 12 years and 7% in just the last 5 years.
Conclusions
Like the number of games in general, the number of expansions released each year is steadily increasing. What’s more, the rate of increase is greater for expansions than for new games. So the anecdotal observation (and oftentimes complaint) that there are more releases, but more of them are expansions is validated. For a discussion about the different types of expansions, expand your reading with my article The 4X's of Expansions.
Hobby Game Trends 2000-2014 Round 5: Economic & Business Games
Category Focus: Economic Games
Now that we understand a little about the categories available on BGG to direct our study, it is time to dive into our first one; Economic Games. Fortunately, BGG has an Economic game category, so our challenge is partly met already. However, we might also consider the question, “What makes an “Economic” game?” A recent Board Game Hour discussion revolved around “Business” games. Are all Economic games Business games and vice versa? Maybe not, but some other game categories and mechanics were mentioned in that discussion to identify a “Business” game that may be relevant, so I’ll take a look at those attributes as well.
At a Glance
Studying “Economic” game releases is complicated by the fact that there is one game that has monopolized the releases in this class for many decades; Monopoly. Monopoly is just one game, right? One game wouldn’t bias the data…
A common gamer complaint is that the standard response to their statement, “I play board games,” is “You mean like Monopoly?” The frequency of this response doesn’t come without cause. The Monopoly franchise is huge and the number of releases of Monopoly per year is also significant. When there is a new version of Monopoly, like the implementation of a licensed IP, there are many releases in different languages and production quality. A “single” release of Monopoly can bias the data for any given year. There is much to be said about Monopoly (and its clones), so we will save that for the next investigation round. Of note here is how I will report the data; with and without Monopoly.
Monopoly vs Modern: Additionally, I will include/exclude the “Roll/Spin and Move” mechanic, which represents many Monopoly clones (as well as Monopoly versions that don’t have “monopoly” in their title). It may be perceived as an unwarranted bias against a particular mechanic, but Monopoly and its clones, represented by the “Roll & Move” mechanic, skew the data for the games that are of primary interest to me. I will call all other games “Modern” Economic games, which may be a slanted term and the data set will surely include some traditional games, but I believe that the trend demonstrated by the data represents that of the modern, hobby game. Note: I will continue to use this term, Modern, and practice with other game categories to be reported later.
The Data
Economic Games
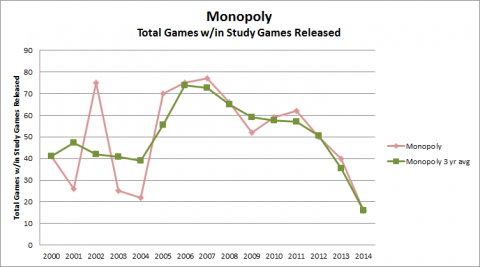
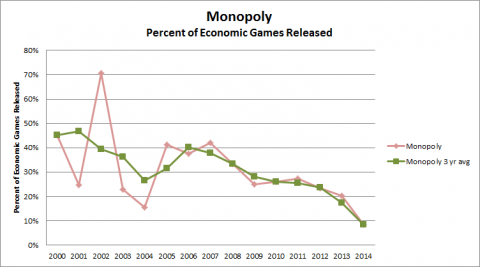
First, let’s look at total games released for all “Economic” games (including Monopoly and all mechanics). There is a steady increase until 2011 and then the releases start to fall off.
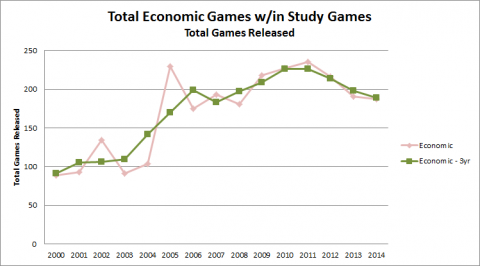
Since all game releases have risen steadily in the same period, we can expect the declining trend as a percent of games released to be even more pronounced. The peak in 2005 is consistent with all games releases, so that should smooth out some, but the low output in 2003 and 2004 is peculiar to this category.
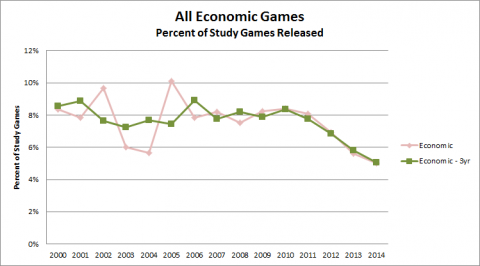
As expected the releases of Economic games is fairly stable until 2007 when it starts a fairly steep drop. The raw data indicates that there may be a leveling out over the last 2 years, but we’ll have to wait a year or so to see if the decline continues or if it has hit a low point and is recovering.
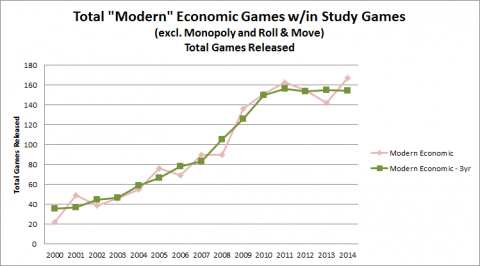
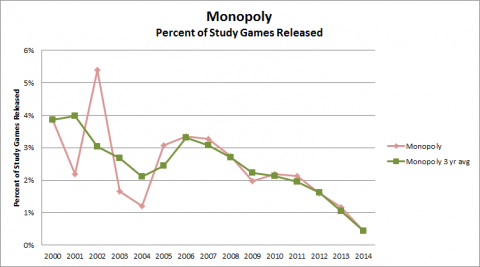
Now let’s take a look at what I have called Modern Economic games. Due to the nature of the BGG search engine, this is a complicated data set to build. (I.E., it is possible to exclude multiple categories, but only one category can be included without narrowing to only games that are in all included categories). First, I have to get Economic games that are not Roll/Spin and Move. Then I have to get Economic games with “Monopoly” in the title that are also not Roll/Spin and Move (to catch the Monopoly games that are not identified as Roll/Spin and Move). This is a small number or releases, peaking at 25 in 2013. However, this is a small data set overall, so small numbers have big effects. I have to subtract the second set from the first set to get what I want. The resulting graphs of total games and percent of Study Games look like this:
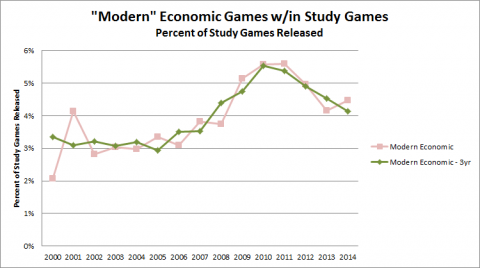
Eliminating the effects of the periodic release cycle of Monopoly smooths out the curve some, but overall the data is still a little erratic. The decline is decreased which indicates something about Monopoly that we will analyze next round.
Note: Even with the exclusion of “Monopoly” and “Roll/Spin and Move,” there are still Monopoly versions in the result set; not many, but some. These tend to be non-English language versions or “Something-opoly” games (since I am filtering for “monopoly”) that have the “Dice Rolling” mechanic checked, but not “Roll/Spin and Move” even though the description of the game includes the phrase “roll and move.” Fortunately, it is a small number of games comparatively, so we will assume we have hit the target data pretty well.
Business Games
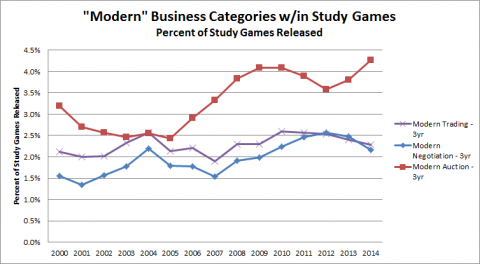
While we are looking at Economic games, it is a good time to also look at “Business” Games. To call a game a “Business” game may be a bit arbitrary, but based on the Board Game Hour discussion, I can assume that there are a few attributes of a game that cause people to think of them as related to business. Fortunately, a couple of these are also available as categories within the BGG data. From the discussion, I am prompted to look at games that include trading and negotiation. To those I have added auction & bidding. There is also a more specific BGG category of stock holding, but the number of games is very small. Let’s first look at these categories individually within the Study Games. Keep in mind that these are comparatively very small numbers of game releases, so any manipulation/math on the data can easily skew the results. I have jumped to the 3 year floating average to concentrate on the trends. Also complicating the data are a few games that have been released regularly in multiple versions.
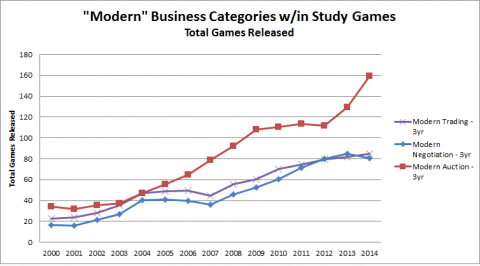
These graphs show that “Modern” Trading and Negotiation games have pretty much followed the trend for all Study Games and Auction/Bidding games have grown at a faster rate. They may have a slight release cycle of about 4 years, but there isn’t strong evidence to confirm this.
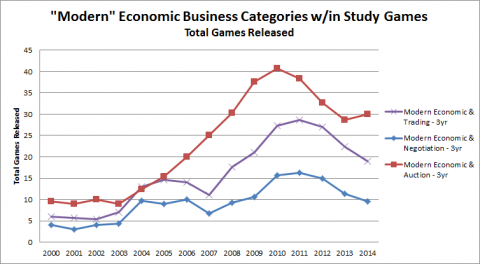
When intersected with the Economic games attribute (games that have both Economic and Trading or Economic and Negotiation, etc.) the release trend takes on the characteristic of the dominant factor, Economic.
Conclusions
It appears that game producers lost interest in Economic games around 2007 and interest continues to drop. Other attributes that are typical of Business games, Trading and Negotiation, are following the major trend of games releases, but when combined with the Economic attribute, they follow the trend for all Economic games. Therefore, there is no distinction within Economic games of a more favored sub-type of Economic game.
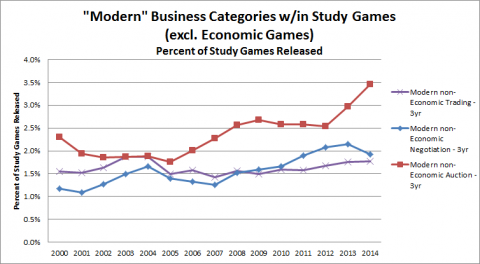
Finally, if we look at these "Business" type mechanics used in games that are not Economic, we see that Trading is generally flat (i.e., matching pace with growth of all releases), Negotiation is showing moderate growth (with the exception of 2014), and Auction/Bidding has had strong growth over the last 10 years.
There are some interesting data related to Monopoly and Roll/Spin and Move games indicated in the data, so we will look at them next in what I will call “Traditional” games.
Hobby Game Trends 2000-2014 Round 6: Traditional Games
Categories Focus: Traditional Games
Hobby game enthusiasts like to think that “better,” more “modern” games are replacing some of the old traditional games. As we saw with Economic games, the traditional game Monopoly has been a significant portion of the releases over the years. Is there evidence that Monopoly and other traditional games are losing their foothold in the games market? Let’s see.
At a Glance
As we looked at economic games, we noticed that there may be something interesting related to the grandfather of economic games, Monopoly. We will use Monopoly and the Roll/Spin and Move mechanic as representatives of “traditional” games.
The Data
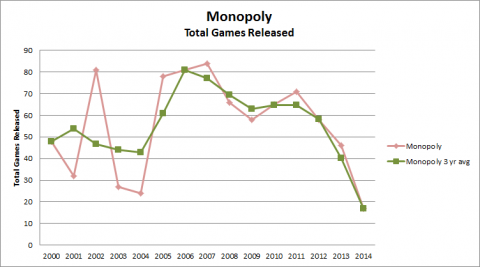
First, let’s look at total Monopoly releases. The number of Monopoly releases peaked in 2006-2007 and has dropped significantly since.
When we limit the releases to those in the Study Games group, the total number of releases drops about 10%, but there isn’t a significant difference to the trend. So from here on we’ll concentrate on games within the Study Games.
Representing the Monopoly releases as a percent of the Study Games, then we get an expected decline, but even over a longer period since overall games releases have been increasing.
As we noted in the previous article, the overall number of economic games had also declined, but not as precipitously. So looking at Monopoly releases as a percent of Economic games within the Study Games, we see a very similar decline.
Now, let’s take a look at the Roll/Spin and Move mechanic. Since Monopoly is a major title in this group, it will impact the overall trend. First, let’s take a look at the total games with the mechanic, then we’ll exclude Monopoly.
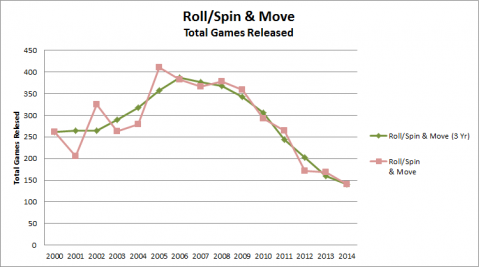
As we saw with Monopoly, the total releases are lower, but the trend within the Study Games is very similar, so we’ll stick with that limitation from here on.
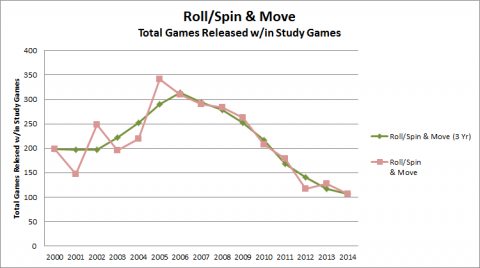
As we might expect from the decline in total releases, the decline in releases as a percent of all releases, which is increasing, is an even bleaker picture for the traditional Roll/Spin and Move mechanic.
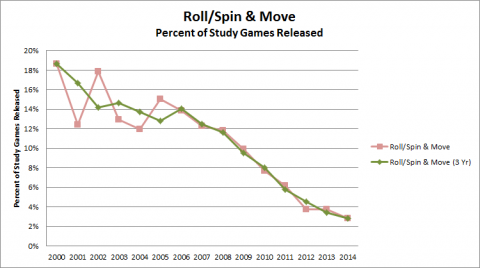
As stated earlier, Monopoly is expected to have a significant impact on this trend (representing 20-25% of Roll/Spin and Move releases), so to be certain that we aren’t just seeing the Monopoly effect, let’s look at Roll/Spin and Move without Monopoly. Note: As before, this is a difficult number to reach due to the nature of the data that can be queried. ([Roll & Move that is not Monopoly] = [Roll & Move] – [Monopoly] + [Monopoly that is not Roll & Move]).
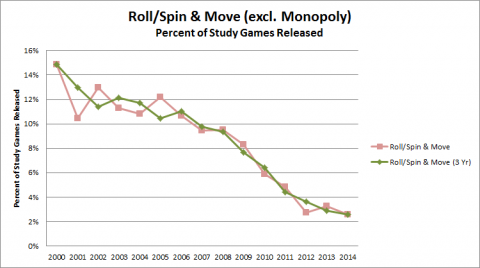
We see a very similar, though slightly slower decline for Roll/Spin and Move excluding Monopoly; a drop from ~14.9% to ~2.6% compared to the overall drop (including Monopoly) from ~18.6% to ~2.8%.
Conclusions
It is obvious that the number of releases of traditional games (as represented by the specific game Monopoly and the Roll/Spin and Move mechanic) is in decline. I don’t want to be too quick to declare Monopoly dead, though. This year, 2015, is the 80th anniversary of Monopoly and a year in which we will certainly see a surge in Monopoly releases. Looking back to 2005-2006, which was the game’s 70th anniversary, there was a small surge in releases, so we might expect the same this year. While there is likely only one specific 80th anniversary edition release, there will likely be releases in other languages and other themes intended to capitalize on the anniversary.
A cursory look ahead at 2015 also indicated that there may be a matter of accounting impacting the extreme decline in 2014. It appears that hobby games releases are announced in advance so they appear on BGG before release. While traditional games like Monopoly are reported after release. This difference could mean that the 2014 release totals are essentially complete for hobby games, but for Monopoly, they will continue to rise over the next year or so as BGG users report those releases. With the small number of total releases, a small number of additions can have a significant effect.
Hobby Game Trends 2000-2014 Round 7: Social Deduction Games
Categories Focus: Social Deduction Games
When I started this research, I was really only interested in “Social Deduction” games, but here it is, round 6 and I am only now getting to the work I set out to do. So much of this hobby turns out that way. Fans and critics alike might say, in different tone, “It seems like every new game is a social deduction game!” As a fan of social deduction games and working on a few designs myself, I am very interested in the current trend in releases of games that fit this category. Is it overrun? Is there room for just a few more great games? (Mine of course will be great).
At a Glance
As with Economic games, defining the category I call Social Deduction games is difficult and even gets trickier. The BGG data does not have a Social Deduction category outright, but affords me two main mechanics categories that are representative of Social Deduction games: Deduction and Bluffing. While there are many games that include either of these mechanics that are not Social Deduction games, Social Deduction games almost always include both.
The Data
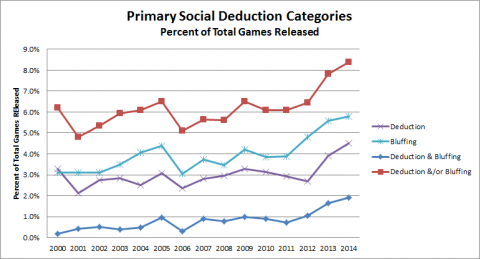
Let’s take a look at the data for games with each of these mechanics, games with both of them (Deduction & Bluffing), and the total of games that have either of them (Deduction &/or Bluffing). The games with both are most likely the “real” Social Deduction games, so we’ll take a quick look at the top-ranked games in that list as well.
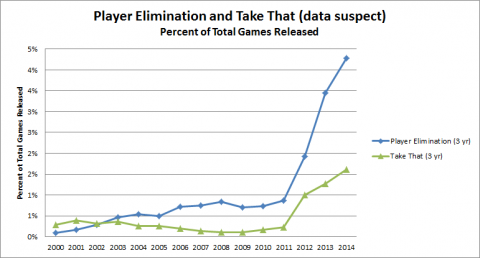
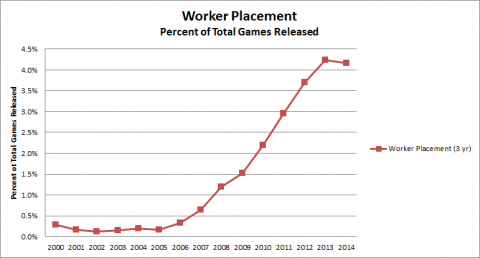
First, let’s look at the total number of games released. Both mechanics have been fairly flat for a while, but have seen substantial increase over the last three years. Naturally, the combination of the two mechanics (games with either of them) rises even more sharply. Meanwhile, the group we are most interested in, those that have both mechanics, has historically been almost non-existent, risen slowly from 2004 to 2011 and then seen a significant bump in the last 3 years.
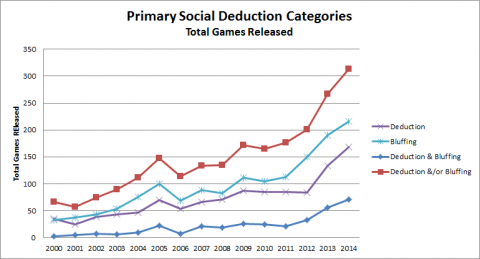
Even with this recent increase, the annual Social Deduction games releases are still less than 2% of all games released.
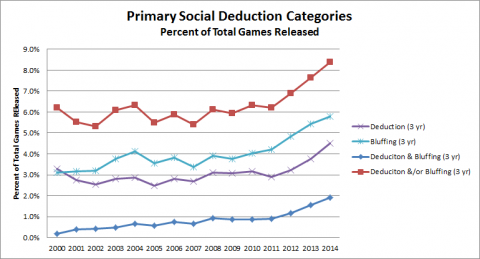
Finally, let’s smooth out those trends with 3-year averages.
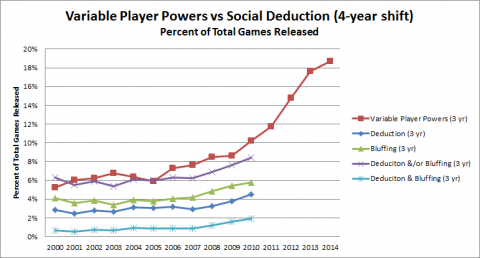
Since this is apparently a relatively new game category, its future popularity, though rising now, is uncertain. Let’s compare it to a couple other game categories that are ahead of Social Deduction on the popularity curve. The lead in both cases appears to be about 4 years.
First, particularly for all those who complain about the emergence of Social Deduction, how about comparing to Variable Player Powers? This mechanic was once unknown, but has risen greatly. The most common question regarding variable player powers in games is likely, “Why does this game not have it?” Social Deduction as a mechanic could take a similar path.
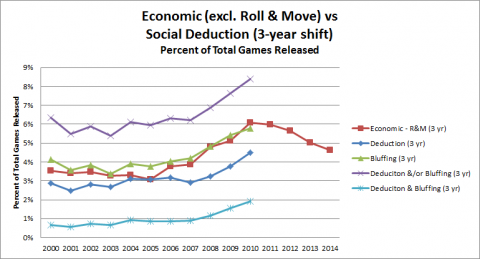
Now, how about a comparison to the trend in Economic games? We looked at them earlier in Round 5. For those that say Social Deduction is a fad and won’t last as a primary game mechanic, this possible future would fit their predictions.
Here is the list of games that fit the Social Deduction query (include both Deduction and Bluffing) that are ranked in the top 1000 or so on BGG. (I included a few more beyond 1000 since Two Room and a Boom was there looking suspicious at 1048). I am not familiar with all of these, but have played many and am familiar with most. Based on my interpretation of a Social Deduction game, I think the query hits the mark pretty well.
|
Games with Both Deduction and Bluffing Categories Assigned |
|
|---|---|
|
Rank |
Title |
|
25 |
|
|
28 |
|
|
76 |
|
|
86 |
|
|
121 |
|
|
167 |
One Night Ultimate Werewolf (Multilingual first edition) (2014) |
|
200 |
|
|
250 |
|
|
314 |
|
|
381 |
The Werewolves of Miller's Hollow (2001) |
|
459 |
|
|
618 |
|
|
643 |
|
|
658 |
|
|
717 |
|
|
720 |
|
|
769 |
|
|
838 |
|
|
840 |
|
|
947 |
|
|
970 |
|
|
1038 |
|
|
1048 |
|
Conclusions
While it is possible for Social Deduction games to tank, they comprise a small percentage of all games and probably have room to grow. I think it is reasonable to expect that releases of Social Deductions games will continue to rise for the foreseeable future, but exactly how much is anyone’s guess. There is probably room for a few more great ones.
Hobby Game Trends 2000-2014 Round 8: Dynasties
Dynasties
When looking at the recent history of board games (say, the last 50 years), it is convenient to put the releases in terms of dynasties. Certainly, one of the oldest and well-established of these is Monopoly. As has been demonstrated in previous articles, Monopoly has dominated game releases for many years. To that list of dynasties, we can add others like Axis and Allies and Risk. Let’s consider how game dynasties are formed and then take a look at some of them in terms of new releases.
At a Glance
The data is not our friend on this investigation. There is no simple way to discover what might be a dynasty. It is more a matter of speculating on which dynasties there have been and then using the data to confirm or refute the speculation. I will posit a dynastic evolution here; knowing that it is essentially impossible to demonstrate the accuracy through the data available. All the same, I will try. If I say something inaccurate, please tell me and we can correct it.
Game dynasties were once strong and built upon the veneration of their leaders by title. (E.g., Monopoly, Axis and Allies, Risk, etc.). Although relatively new on the scene in comparison and praised as the best new thing, Catan and Carcassone established similar dynasties (though with some differences we will explore).
Then there was a period when individual hobby games exploded on the scene; the “cult of the new” and Kickstarter followers venerated many leaders instead of just a few. The risk/reward is high in this interim, feudal period where there are many new designers to discover and titles to try and universes to explore.
Are we heading into a new era of dynasties? What are the bases for those dynasties? We will explore a a couple possibilities.
The Data
On BGG, the best way to find most dynasties is through the “Family” category. The tallies for each family below include anything that matches, including promo cards, etc.
Ancient Dynasties
These dynasties were built primarily on title recognition. Although there were always new releases with trendy covers, the games inside the box were essentially the same as the releases last year and last decade. They disguised themselves in new clothes, sporting new art and different, exciting locales.
Monopoly (est. 1933, 923 titles on BGG): We’ve seen plenty of Monopoly data, so rather than repeating it here, I will just reference the original articles about Economic games and Traditional games. Let’s first take a look at some of dynasties with which Monopoly had to share the gaming universe for decades.
Risk (est. 1959, 60 titles on BGG): Traditionally holding a strong market share, Risk actually does not have a lot of separate releases compared to Monopoly. Risk has managed to keep its place without a lot of fancy dress. Consider it a stealth dynasty (e.g., Australia before the moon came into play).
Dungeons & Dragons (the RPG) (est. 1975, 116 titles on BGG): D&D started and dominated the role playing game genre for over a decade. It is a complicated beast to quantify, though, as it has been primarily a gaming system with offshoots and eventually an open license. D&D has re-invented itself in recent years as a universe for board games and will get a mention later as well.
Axis and Allies (est. 1984, 40 titles on BGG): Axis and Allies has maintained its dynasty similarly to Monopoly by providing the same game mechanics with different maps and bits. Although it didn’t appear until the modern era, Axis and Allies may be the last of the old guard. (Although I still have my first edition of Axis and Allies, bought new in 1984, I have never played it due to the lack of fellow fans. I played a friend’s copy, bought my own and never had the chance again. Pardon my ignorance.)
Middle Ages
In the middle ages, new games were coming onto the scene and establishing dynasties. They signify the transition from the ancient to the modern, by still trading on their name recognition, but actually often putting something mechanically different in the box. You know you’re onto a possible dynasty when every title includes a “:” and you hit on most of the following: “The Card Game,” “The Dice Game,” “Junior,” and at least one location name.
Magic: The Gathering (est. 1993, is it even possible to track): What is there to say? BGG is not helpful in collecting data on Magic releases, but it is obvious that this game has captured the hearts and minds of many a gamer, youth in particular. Magic stays young by continually re-inventing itself without completely breaking its former self.
Catan (est. 1995, 130 titles on BGG): Catan and Carcassone start to tread on the modern era with their continuous stream of expansions and take-offs that expand the universe they originally established. However, Catan in particular relies on the old method of looking sharp by putting the same old body in new clothes (Star Trek: Catan).
Carcassonne (est. 2000, 76 titles on BGG): Carcassonne gets closer to the modern age by staying in power through expansion rather than new clothes.
The Modern Age
Now let’s take a look at some of our newly ordained leaders and ones that might be on the verge of a dynasty. I can think of two main bases for dynasties in the modern era; Name Designers and Known “Universes.”
Name Designers
Since the dawn of “designer” games several designers have made names for themselves and have been prolific producers. These dynasties may rely on a particular title, but often do not. They are built on the gravitas of the designer’s name above all else. There are many designers meeting this metric, but here are a few with their dynastic stats. There are many up-and-comers as well. Predicting who will reign on for a long time is a game unto itself. Who on this list do you think has established their dynasty and who do you think still needs to prove themselves? Based on the data for the historical dynasties I have mentioned I’ll set a somewhat arbitrary metric for a designer dynasty.
- Duration: 15 years (established 2000 or earlier)
- Breadth: 40 titles or more
- Strength: 5 titles in the top 1000
Most of the following designers have established dynasties well beyond my threshold.
Established Designer Dynasties
|
Designer |
Established |
Titles |
Top 1000’s |
Highest Ranked |
|---|---|---|---|---|
|
1974 |
199 |
22 |
22: El Grande |
|
|
1977 |
104 |
13 |
||
|
1987 |
98 |
10 |
||
|
1990 |
437 |
37 |
||
|
1992 |
104 |
14 |
||
|
1992 |
76 |
11 |
10: Power Grid |
|
|
1992 |
44 |
10 |
50: Goa |
|
|
1993 |
87 |
24 |
15: Brass |
|
|
1993 |
57 |
8 |
||
|
1997 |
105 |
12 |
||
|
1997 |
41 |
9 |
||
|
2000 |
237 |
12 |
Not to be ignored, though, are the many designers who are very close to my threshold; most just needing a few more years in game design, a few who have been around awhile, but are only recently establishing growth, some expanding their reach very quickly. Additionally, some of these designers are also establishing dynasties as publishers.
Emerging Designer Dynasties
|
Designer |
Established |
Titles |
Top 1000’s |
Highest Ranked |
|
1989 |
22 |
5 |
31: Keyflower |
|
|
1995 |
17 |
5 |
44: Pandemic |
|
|
2002 |
83 |
14 |
82: Five Tribes |
|
|
2002 |
76 |
6 |
||
|
2003 |
56 |
11 |
||
|
2004 |
21 |
8 |
||
|
2005 |
35 |
16 |
||
|
2005 |
60 |
4 |
45: Suburbia |
|
|
2005 |
14 |
8 |
65: Concordia |
|
|
2006 |
56 |
15 |
||
|
2006 |
13 |
5 |
23: Dominant Species |
|
|
2007 |
61 |
7 |
17: 7 Wonders |
|
|
2008 |
43 |
4 |
||
|
2008 |
11 |
5 |
46: Troyes |
|
|
2009 |
41 |
6 |
Known “Universes” and “Systems”
These often overlap with the designer dynasties, but not necessarily. The universe is often IP that is held by a publisher and several designers may design games in its space. Nostalgia seems to be a driving factor in the popularity of some of these universes. Here are a few established and emerging universal dynasties:
|
Universe |
Established |
Titles |
Titles > 2000 |
Top 1000’s |
Highest Ranked |
|
DC Universe**** |
1940 |
98 |
50 |
2 |
|
|
1959 |
140 |
101 |
5 |
||
|
1967 |
368 |
240 |
3 |
||
|
1975 |
116 |
91 |
8 |
||
|
1977 |
209 |
148 |
6 |
||
|
1986/2001 |
106 |
105 |
7 |
||
|
2000 |
63 |
63 |
7 |
||
|
2004 |
59 |
59 |
4 |
||
|
2005 |
34 |
34 |
4 |
24: Eldritch Horror |
* There are a few in here that, by age, might fit a different era, but their popularity is on the rise.
** I included D&D in this age because it is only recently becoming a force in board games.
*** Werewolf/Mafia was originally published in 1986, but spent many years as essentially a fan-based game. The concept started getting used in published games more frequently after 2001.
****Although the DC universe probably doesn’t meet the standard set by the other dynasties here, it is listed for comparison to Marvel.
Note: Title counts might include fan expansions, which I left out of most statistics, but left in here as these indicate a strong following.
The Feudal Lords of Kickstarter
Much is said and written about the positives and negatives of Kickstarter. I won’t get into that foray, but will just provide some statistics supporting the idea that we are currently in an age of game publishing when individual games can make an impact over the traditional dynasties like no other time. Additionally, small publishers leveraging Kickstarter are able to compete with large publishers.
Kickstarter
|
|
Established |
Titles |
Top 1000’s |
Highest Ranked |
|---|---|---|---|---|
|
2009 |
2636 |
77 |
Some noteworthy facts about the Kickstarter titles listed on BGG that impact the interpretation of this data:
- Many titles were previously published and were reprinted (and usually upgraded) through Kickstarter.
- About 140 of the titles counted (~5%) have not been published at this time.
- I don’t understand all the reasons for associating a title to the Kickstarter family.
Caveats aside, though, Kickstarter is a force in publishing. It may not qualify as a dynasty due to its demographics, but it could be the democracy that destroys dynasties. Or it could collapse under its own weight in a few years.
The Sage Who Spanned the Ages
Based on my approach, when I first developed the data for this article and wrote it, I missed arguably one of a very few most important designers of the 20th century. Rather than add him into the rest of the designers, it makes better sense to give him his own category because his dynasty spanned the ages from the Ancients through the Middle Ages and even with a few entries into the Modern Age, though he passed away in 2002.
The designer who spanned the ages was Sid Sackson. His impact on the industry far exceeds the BGG statistics about his published games, but those are shown here. Although Acquire holds a respectable rank of 124 on BGG, the likelihood that a 50 year old game making the top 1000 is remote and speaks volumes about this dynasty.
Sid Sackson
|
|
Established |
Titles |
Top 1000’s |
Highest Ranked |
|---|---|---|---|---|
|
1951 |
125 |
4 |
140: Acquire (1964) 486: Can’t Stop (1980) 600: I’m the Boss (1994) 729: Sleuth (1971) |
Mr. Sackson started in the industry and designed many of his games in an age when designers were not mentioned in the rules, much less the box, yet he broke out and became one of the most recognized and revered names in game design.
Conclusions
The ability to capitalize on a known brand is an enticement to label everything new under one of those known brands. Many games could be branded and marketed as completely new or with borrowed title, art, and all from a known winner. We see it in all of media and entertainment, it only makes sense for games to follow the masses.
How long do you think the current dynasties will continue to reign? What do you think are the next dynasties? Or do you think that the feudal age will continue for the foreseeable future?
Hobby Game Trends 2000-2014 Round 9: Self-Publishing
Self-Publishing: The Kickstarter Effect
This article looks briefly at self-publishing and the effect that Kickstarter has had on it. This is not a focus on Kickstarter itself, but there is more about it in Round 9: Dynasties.
At a Glance
Kickstarter has provided a platform for lone game designers to publish their work. Let’s take a look at the history of self-publishing and Print & Play games and see if we can detect any impact from Kickstarter.
Unfortunately, BGG uses the Family classification to identify Kickstarter games and as mentioned earlier, the Family classification is not available for searching in the advanced search. It is available in the regular search, but that does not allow me the flexibility to limit the search by my other criteria. Another complication results from the fact that many Kickstarter published games are new editions of existing games, so the BGG record of the game shows a publication year for the original.
The Data
Let’s take a look at the total releases of Self-Published, Print and Play (Self-Pub PnP)games and then as a percent of total games released.
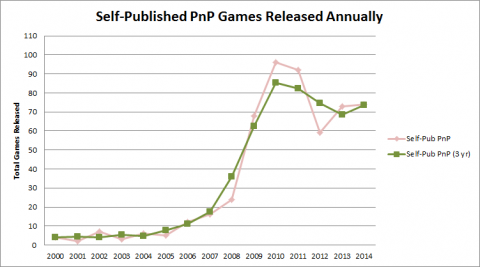
This is a very striking graph and possibly illustrates several trends; and possibly at least one that has little to do with Self-Pub PnP games. Three important dates come to mind when looking at these trends: (One at the beginning of the timeline and two near the end).
- January 2000: BoardGameGeek launches
- April 28, 2009: Launch of Kickstarter
- June 26, 2010: Alien Frontiers Funded
Let’s first look at the early years on the curve. It appears that there were almost no Self-Pup PnP games released until about 2005 when they started taking off, but let’s look at some facts that may impact that interpretation. The ability to self-publish and the viability of PnP has existed since the mid-80s, so certainly games were being printed at home. An example of what has been possible, although not included in this chart, Cheapass Games started a very successful business based on small-business printing capabilities in 1996. So this apparently slow start is almost certainly related to reporting. Since BGG did not exist until 2000, these games were not getting reported until BGG gained in popularity and essentially no one is going back in history to report them now.
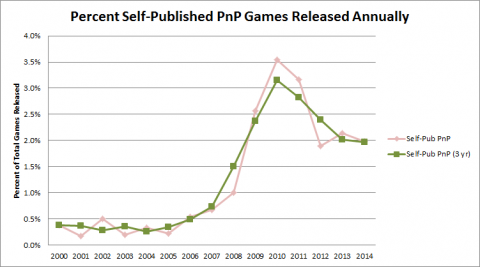
The significant rise from 2006 to 2010 is probably a combination of increased reporting (mostly at the front end) and increased production (mostly at the back end.
Now, what about the peak at 2010 and the decline since? I would acknowledge this trend as real (BGG reporting has been solid since 2010) and attribute it to the arrival of Kickstarter on the scene. Many games that would have been Self-Pub PnP have hit Kickstarter instead.
Conclusions
It is obvious that Kickstarter has had a tremendous impact on the Self-Pub PnP market; essentially transferring most of those efforts into Kickstarter published games.
Hobby Game Trends 2000-2014 Round 10: Themes
Categories Focus: Themes
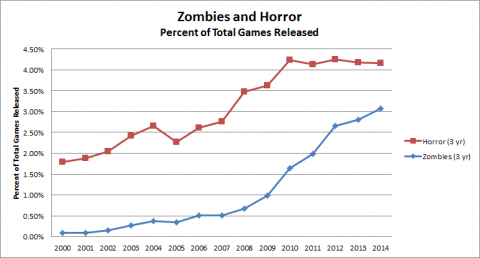
We have already looked at a few genres; those related to economic games and social deduction games. Let’s take a look at a few others that are thematic based and may be interesting. One that I know many gamers would love to see is “Zombie games,” but there are many other themes that gamers feel have been either over-used or under appreciated. We’ll take a look at a broad list of themes in this round.
At a Glance
A glance is all we are really going to take in this round. I’ll provide the basic chart showing releases of games of a particular theme as a percent of Study Games for each theme and leave the interpretation to you. Remembe, Study Games are all titles in the BGG database excluding: Children's Games, Mature/Adult Games, Fan Expansions, Books, and the Roll/Spin and Move Mechanic.
The Data
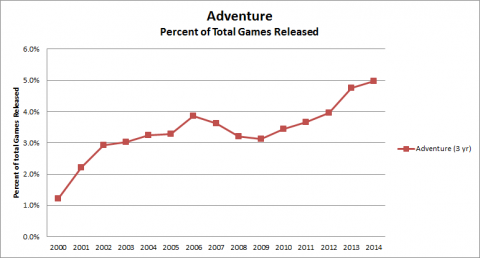
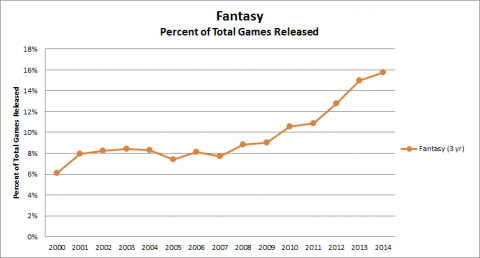


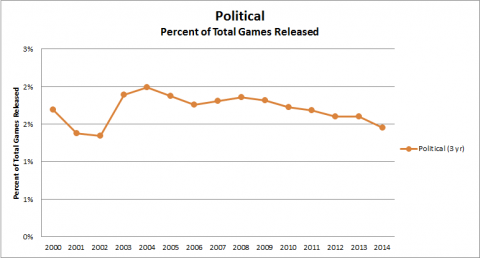

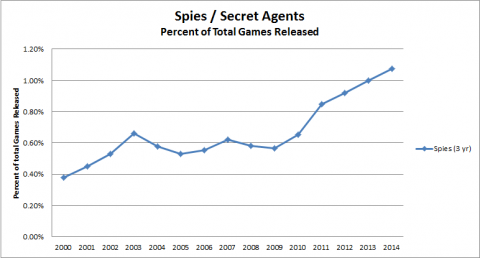
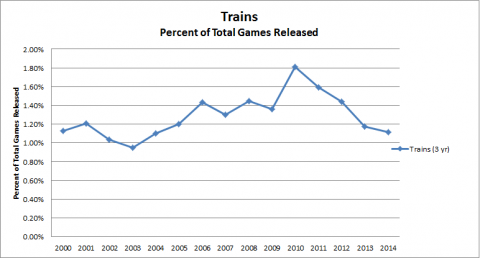
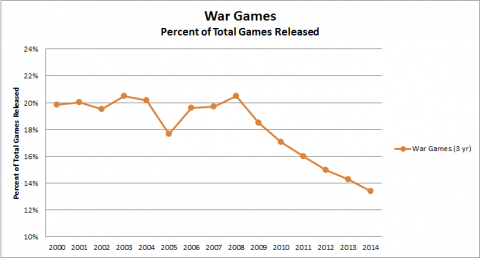
Conclusions
Hopefully, this data is helpful to you and gives insight into a theme that interests you. In all cases, consider this data to be a starting space for your discovery on a particular topic.
Hobby Game Trends 2000-2014 Round 11: Mechanics
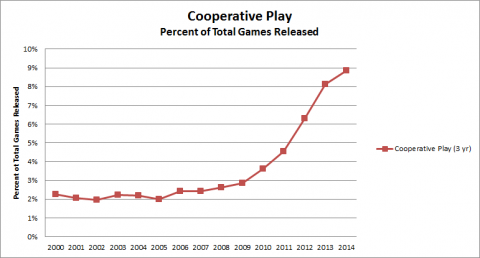
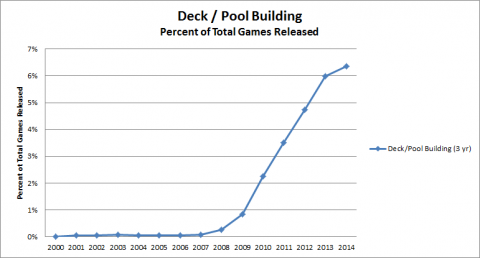
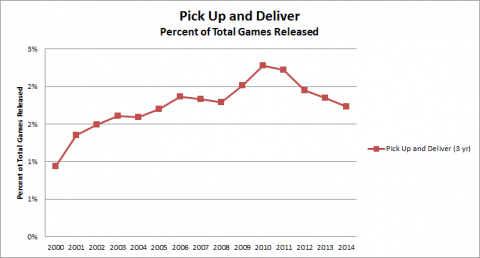
Categories Focus: Mechanics
We have already looked at the Roll/Spin and Move mechanic extensively in the Traditional Games round and Deduction and Bluffing in the Social Deduction games round, but what other mechanics are rising or declining in interest from publishers?
At a Glance
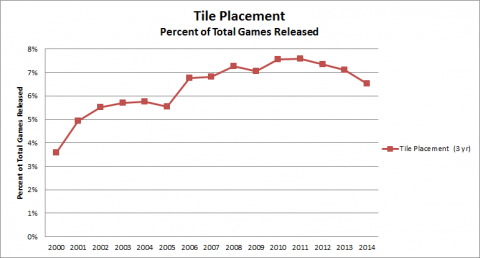
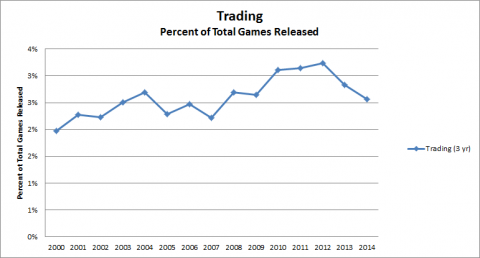
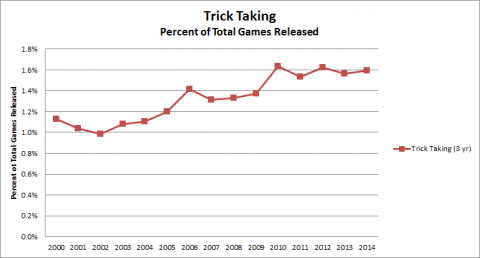
A glance is all we are really going to take in this round. I’ll provide the basic chart showing releases of games of a particular mechanic as a percent of Study Games for each mechanic and leave the interpretation to you. There are probably other mechanics of interest, but I searched the ones most interesting to me. Some are not as useful as you would hope, e.g. Card Drafting means drawing cards in any way. Others appear to have been added to the categories fairly recently and older games have not been updated with them; particularly Player Elimination (which would have been interesting to me) and Take That. I’ve kept these in, but tread lightly around these. (At least that is the best reason I can find for their wonkiness). If there is one you particularly want to know, just comment and ask. Remembe, Study Games are all titles in the BGG database excluding: Children's Games, Mature/Adult Games, Fan Expansions, Books, and the Roll/Spin and Move Mechanic.
The Data

Conclusions
Hopefully, this data is helpful to you and gives insight into a mechanic that interests you. In all cases, consider this data to be a starting space for your discovery on a particular topic.
Hobby Game Trends 2000-2014 Final Round: Conclusions
Conclusions
I am very pleased that this research confirmed some general speculations about the hobby game industry while it tempered others. Here are a few final conclusions, as always with the caveat that this research is based on the data available in the BGG database. There is much that can be discovered in the analysis and I extended to many areas in which I was not specifically interested now, but I wanted to leverage the process while I was practiced at it.. So the following conclusions are not all that can be drawn from the data, but just a few that interested me. Read the specific articles to better understand each category and the data challenges associated with it. You can review all of the figures that were included in the articles in the Hobby Game Trends 2000-2014: Figures gallery. It is worth repeating here that some of the data sets are so small that they are prone to large swings when calculating changes.
Social Deduction Games
When I set out to mine the BGG database I was primarily interested in answering 2 questions:
- Is there a social deduction game boom? It seems like every other new game is a social deduction game, but maybe that is due to the games that catch my interest right now are ones that meet that criteria.
- Is there room for more? I have a few game designs in progress for which social deduction is the primary mechanic. Am I entering the market at the wrong time?
Yes, though social deduction games are rising in popularity, they are a very small segment of all games released. My next analysis related to social deduction games is to look at what makes one and to compare several popular games in the genre based on criteria that I am developing. As usual, this is not to review the games, but to identify how they use the social deduction mechanic and how they differ. Watch for this series of articles coming soon in the Game Design Notebook under Game Genres.
As I started researching the data, though, I started asking other questions and other avenues were opened due to other discussions that I took part in. I made a few conclusions along the way and left a lot to your own discovery, but here are a few noteworthy conclusions from the series.
Annual Games Releases
Yes, there is an increase in new games releases every year and there has been for the last 15 years. The last 7 or so years have seen an acceleration in that increase, though, unlike the anecdotal evidence that it is growing exponentially, the acceleration (the increased rate of increase) has been mild (about 0.5% per year).
Why is there a disconnect between what we see and what the data supports? Here are a few suggestions:
- The number of releases for a traditional game and for hobby games are not equal, so as traditional games get replaced by hobby games, the actual number of new games increases.
- 40 new releases of Monopoly look like 1 new release (if that).
- 40 new hobby games with different titles look like 40 new releases (and are).
- People interested in the hobby game industry are not even looking at traditional games. They are not “released at Essen” or “released at GenCon.” They just show up on the shelf at Target.
- The prevalence of dynasties has fallen off (at least temporarily), so most new releases are new games, not just repackaging of the same game. (See Expansions).
Expansions and Dynasties
Yes, the number of expansions released is growing each year and the percentage of new releases that are expansions is also growing. I have collected the conclusions about expansions and dynasties into one category because I think some of the current and future dynasties are built on expansions.
Instead of re-theming and light changes to Monopoly to make Monopoly: The Lord of the Rings Collector’s Edition, we will see more dynasties built on expansions and take-offs like Catan (which has over 130 titles listed on BGG! – yes, several are promos, but not that many) and one that is emerging now, Pandemic. It may have been off to a slow start as a dynasty, but it is in full break-out mode now.
- Pandemic (2007)
- Pandemic: On the Brink (2009)
- Pandemic: In the Lab (2013)
- Pandemic: Contagion (2014)
- Pandemic: The Cure (2014)
- Pandemic: Legacy Season 1 (2015)
- Pandemic: State of Emergency (2015)
You might even include these titles in this dynasty, depending on how you are defining it:
- Forbidden Island (2010)
- Forbidden Desert (2013)
Is there any doubt that there will be at least one new release in 2016?
Economic Games
Yes, gamers are tiring of “traders in the Mediterranean” games. Economic games had a steady increase from the beginning of the study data (2000) until about 2011. Since then new releases have been declining steadily.
Yes, particularly interesting is that some mechanics typical of economic games continue to rise, but not in economic games; Trading, Negotiation, and especially Auction/Bidding are all popular in new releases. Presumably these mechanics are being used in non-economic, non-traditional ways.
Traditional Games
Yes, the decline in releases of traditional games is obvious and striking. Although, this data does not represent the number of units sold, it is obvious that game publishers are putting their stock in hobby games. We can all do a victory lap. The next time you get pulled over by a cop late at night and say, “I’m just driving home from playing board games with friends.” The cop might say, “Board games? You mean like Pandemic?”
Since I did not include children’s games in this study, it would be interesting to know if there is a similar movement in this category. Certainly with great publishers like HABA (on BGG) and Blue Orange Games (on BGG) growing internationally, there is hope for the future of the gaming universe.
But Wait, There’s More…
Note: At the time I am writing this, I am not adding other chapters, but if I do further research along the same lines, I will add it into the notebook. I certainly plan to look at the 2015 data for some of the categories already researched to see if it meets my predictions. So you can expect me to add at least one more chapter in early 2016.
If there is any category or topic that you are interested in knowing more about, please comment and I will see if it is something I can add to this research. If you have any questions about how I collected this data or drew my conclusions, please comment. It is highly likely that you have questions or ideas that can help extend this information.
Spiel des Jahres & the BGG Community - Part 1
Setup
Though some table top gaming enthusiasts believe that the Spiel des Jahres annual awards are not relevant for them, there is no doubt that these awards are important drivers in table top games in general. There is enough urban legend and pontificating about the awards that don’t report the facts that a deep dive into the statistics related to the awards is perfect for an article in the Analysis Paralysis series. Through this analysis, we will have a better idea of what makes a Spiel des Jahres game, the common aspects of the games that have been named in the awards – as winners, nominees, or recommendations – and how the awards have changed over the years. In particular, we will viewing this information through the lens of the BGG community (as expressed in the game and user data available on the BGG website). Eventually, we will also be able to compare data for the 2017 nominees before and after the awards to gauge the impact.
Round 1: What is the Spiel des Jahres
From the Spiel des Jahres website FAQ: “’Spiel des Jahres’ is an award for analogue tabletop games in German-speaking countries, which was first’ awarded in 1979. German-language games released in the current and previous year can be considered for the award.” The Spiel des Jahres is awarded annually by a jury of independent “games critics”; journalists and analysts that report on the German language table top game market. A complete description and the awards can be found on the official Spiel des Jahres website. The website is natively in German, but an English version is available for most pages. Currently, the award is actually three awards differentiated by their expected audience, but that has not always been the case and will be the subject of future articles. The awards are:
- Spiel des Jahres (SDJ) – The original award commonly referred to as the “family and friends” board game of the year. (First awarded in 1979.)
- Kennerspiel des Jahres (KSDJ) – Focuses on games for more advanced gamers or “connoisseurs”. These games are often popular games on BGG and are included in this analysis. (First awarded in 2011.)
- Kinderspiel des Jahres – Focuses on games specifically for children. These games often do not make it to the North American market and are typically not of great interest to the BGG community, so I have not included them in this analysis. (First awarded in 2001.)
We will also look at the games mentioned in the awards that were not winners – what we will call the Award Level. These are generally:
- Finalist – the games nominated for the award, but did not win.
- Recommended – other games considered that did not make the nominations, but are recommended by the jury.
- Special – other games that received special recognition in addition to the recommended games. Usually a game that was considered to meet the quality criteria for the awards, but is outside the specific audience.
Round 2: A Very Brief History of the Award(s)
The first Spiel des Jahres was awarded to Hare & Tortoise in 1979 which, as we will see, seems very appropriate given how well this game represents the collection of games that have won the SDJ over the years. Since then, the award has been consistently awarded annually, but the number and type of awards and nominated games have changed over time. The number of nominees for any of the awards has typically been three games, but that is not a hard rule.
Although the award had a relatively specific target audience, the range of qualifying games spanned a greater audience than a single award could represent so in 2001 the Kinderspiel des Jahres was introduced to acknowledge children’s games and in 2011 the Kennerspiel des Jahres was introduced to give similar recognition to more advanced games. Along the way there were 1 to 3 special awards given in 21 of the 31 years between 1980 and 2010.
Round 3: The Statistical Data to be Analyzed
The data presented in this series of articles is completely derived from and available on the Spiel des Jahres website and BoardGameGeek.com. I have not listed the game pages individually, but all credit for the acquisition of the data goes to the BGG team and user community. I have consolidated the data and analyzed the results. There are 232 games mentioned in the awards. The specific data used from BGG includes:
- BGG Rank
- BGG Category Rank
- BGG Rating
- Average BGG User Rating
- BGG User Game Weight
- Published Game Play Time
- Published and BGG Community Age Range
- Published and BGG Community Player Count
- BGG Game Type Categories
- BGG Mechanics Categories
Round 4: Challenges within the Statistical Data
As always, there are some challenges in analyzing the BGG data. In this case the greatest challenge is the time it takes to collect, evaluate, and report the data compared to the mobility of the data. So I can’t say that this data represents a point in time. It more accurately represents several points in time. The impact to the data and analysis should be negligible since we are looking at averages and trends over several years. In particular, however, the data for the 2017 nominees (and to a much lesser degree the 2016 nominees) is changing rapidly as these games are being discovered and reviewed for the first time by a much larger audience than before the announcement of the nominees. However, the change in the data is instructive as well. For the 2017 nominees we may be able to gauge the impact of the awards.
There is also a slight limitation in that some of the mentioned games are not listed on BGG. This is a small number, though, only 3, so does not have a large impact on the data. Another 6 games do not have a BGG Rating or Rank (they have too few User Ratings), so the data is limited on these. Several others also have a small number of user responses to the community statistics (Player Count, Weight, etc.), so do not have a statistically good numbers for those aspects. However, I used all of the data available.
End Game
Over the next several articles we will look at BGG statistics regarding Spiel des Jahres mentioned games from its first year (1979) through the current year (2017). If you have any interest in the awards, you should find this information interesting. Even if you think that the awards are too focused on children and family games, you may be surprised by the data. This analysis will include many graphs for you to make your own judgements. If the analysis sounds interesting, subscribe to the series or watch for future articles to stay informed.
Additional parts to this article are available here:
- Spiel des Jahres & the BGG Community - Part 1
- The Full Weight of the Spiel des Jahres - Part 2
- How do Spiel des Jahres Winners Rate? – Part 3
- Industry Focus: Buy and Play Spiel des Jahres Games– Part 4
- Industry Focus: What Makes an SDJ Winner? – Part 5
- Industry Focus: The Impact of SDJ Consideration – Part 6
Your Turn
Do you pay attention to the Spiel des Jahres awards? Do you find that the Kenner Spiel des Jahres award is more relevant to your gaming preferences? Before getting into the data, think about what you believe about the awards and check how that changes when you see all the data.
Flavor Text
I have staged a significant amount of data and analysis for these articles, but am waiting on the 2017 award winners to be announced to publish it. With the awards for SDJ (Kingdomino) and KSDJ (EXIT: The Board Game) yesterday (July 17), the series will be published over the next several weeks. (Note: after having immersed myself in these awards for the last few weeks, my unpublished predictions were correct – you’ll have to take my word on that). I will update this article with an index of the other articles so you can jump to the ones that most interest you.
Based on the dialog about the awards on gaming podcasts and forums, I was originally interested in the game weight and the rank/rating, but expanded my discovery to the other statistics.
The Full Weight of the Spiel des Jahres - Part 2
Setup
The Spiel des Jahres (SDJ) award is intended to recognize games for “family and friends.” Does it hit that mark? The Kennerspiel des Jahres (KSDJ) was created to recognize more advanced games. Anecdotally, this is obvious from the difference in games that have won the awards, but is there a way to quantify this difference? Not dissimilar from other media, the complexity level of a game is represented by what gamers generally call “weight,” which is available as a community contributed measurement on BoardGameGeek.com. All graphs have been derived from data obtained from BoardGameGeek.com in June and July 2017.
Let’s take a look at the weight of SDJ and KSDJ winners and nominees over the years for insight into their level of complexity:
- What are their average and relative weights?
- Have their weights changed over the years? (Are the games getting more or less complex?)
- Have there been major changes over the years? What were the likely events that caused these changes?
Note: If you are starting your reading with this article, you might want to jump to the introduction here: Spiel des Jahres & the BGG Community Part 1
Round 1: What does Weight Mean?
The BGG Weight rating is intended to quantify the complexity of a game, how difficult is it to learn and play – not to be confused with how difficult it is to win. The value reported for each game is based on community votes given the following recommended weights:
- Light
- Medium Light
- Medium
- Medium Heavy
- Heavy
Data Note: Although this is a 5 point scale, it is important to note that the lowest rating is 1.00 and the highest is 5.00, so there is really only a potential 4 point difference between the lightest and heaviest game ratings.
Round 2: Average and Relative Weights
First, let’s look at the average and relative weights of the games mentioned in the two awards. Note: This graph excludes the games given “Special” awards. We will look at them later. For the following graphs, the height of each bar represents its weight (also indicated with a number at the top) and the color of the bar represents the number of games included in the calculation for that bar.
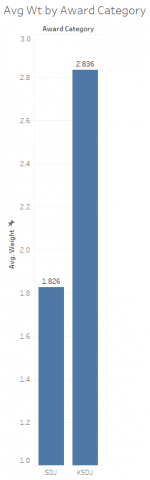
The average weight of the SDJ games (winners, nominees, and recommended) is 1.826 – just under “Medium Light” and the average weight of the KSDJ games (winners, nominees, and recommended) is 2.836 – just under “Medium.” Neither of these ratings is surprising to me. The KSDJ games are a full point, 25% (if we can think of it that way) more complex than the SDJ games.
Now, let’s break the data down a bit further and look at the different statuses (winners vs. nominees, etc.). This time we will include the “Special” awards as well.
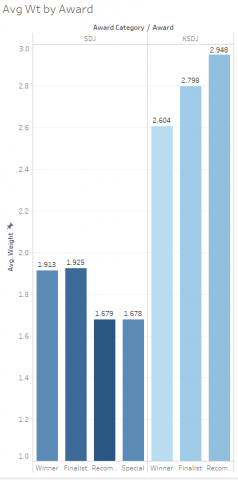
Although the difference is very small, I am surprised to see that the SDJ winners are a fraction more complex (+0.087 or 5%) than the average game considered for the award. The finalists represent the most complex games. The difference is greater for the KSDJ games, but in this case the winners are measurably less complex (-0.232 or 8%) than the average game in consideration. In this case, the recommendeds represent the most complex and winners the least.
So far we have been talking about averages, but since a main interest to the typical BGG user is heavier games, a look at the maximum weight for each award might be interesting.
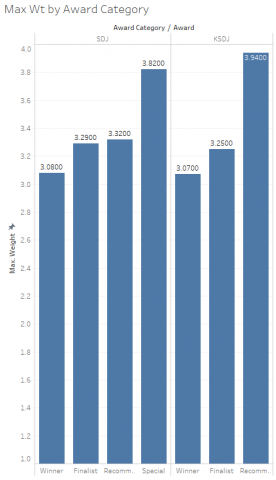
Even if nothing has been surprising so far, this data should get your attention. First let’s look at the SDJ winners. The max weight of a winner (3.08, a solid “Medium”) is 1.167 heavier than the average (1.913, “Medium Light”). The difference for recommendeds is the greatest at 1.641 (3.32 vs. 1.679).
The difference for KSDJ winners is also large, but not as drastic, at 0.466 (3.07 vs. 2.604). As with the SDJ, the recommendeds represent the greatest difference at 0.992 (3.94 vs. 2.948). The heaviest game here, at 3.94 (a solid Medium Heavy weight), is very heavy in comparison to the general population of games on BGG. There are very few games on BGG with weights over 4.
The fact that the recommended games for each award show the greatest difference makes sense. These games were considered for the awards, but did not make the finalists; possibly because of their weight.
Given the great differences in the SDJ winners in particular, several questions arise:
- What games were these and when were these heavy games considered for the awards? (from left to right on the graph)
- SDJ Winner (1996): El Grande
- SDJ Finalist (2002): Puerto Rico
- SDJ Recommended (2011): Luna
- SDJ Special (2006): Caylus
- KSDJ Winner (2012): Village
- KSDJ Finalist (2017): Terraforming Mars
- KSDJ Recommended (2013): Terra Mystica
- Were these games just outliers or has there been a trend over time? We’ll look at that in the next section.
- What’s with the Special awards? They have the biggest difference at 2.142! We’ll look at the special awards in a section by themselves a little later, but will refer back to this graph.
Round 3: Weight Trends
First, let’s look at the average weight of games for each award by year (excluding Special awards).
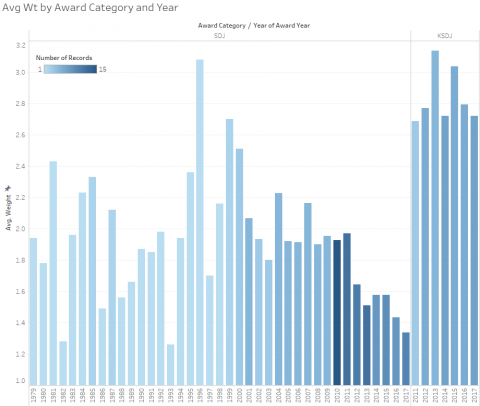
First, a side note: As indicated by the color of the bars, the number of games considered and recognized in some way has grown significantly over the years. The SDJ jury is a busy organization these days.
As before, the difference in the average weight between the SDJ and KSDJ games is obvious, but let’s look a little closer. The KSDJ award is intended to recognize heavier games so it makes sense that the average weight of SDJ games would have dropped since the introduction of the KSDJ. Looking at the SDJ average weight for the years 2011 to 2017 this appears to be true and is verified in the following graphs showing the average weight of SDJ games in a year with a KSDJ award (True) and without (False).
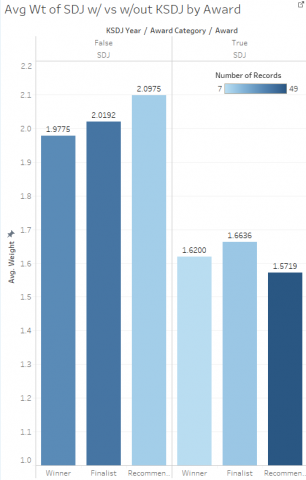
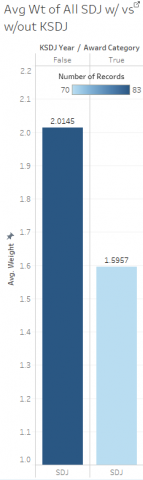
OK, so this is no surprise, but it is validation of the SDJ jurors’ intent.
While the average weight of considered games was rising during the years leading up to the introduction of the KSDJ, it has dropped significantly since the KSDJ has been an option. (Excluding 2011, when it appears that the SDJ/KSDJ distinction was in transition, the awards show a distinct step down.)

However, throughout the SDJ award history, though the considered games were gaining in weight, the weight of the winner has been fairly consistent until the introduction of the KSDJ.
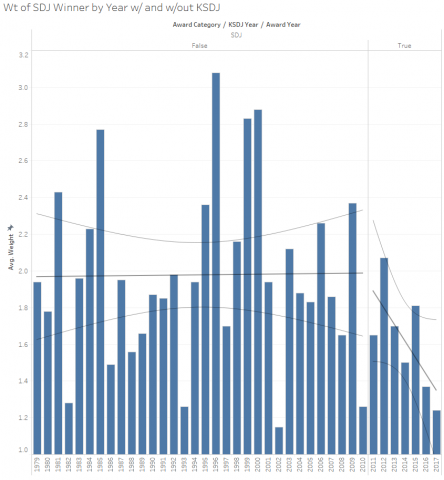
Even when eliminating the “transition year” (2011), there is a trend toward lower weight.
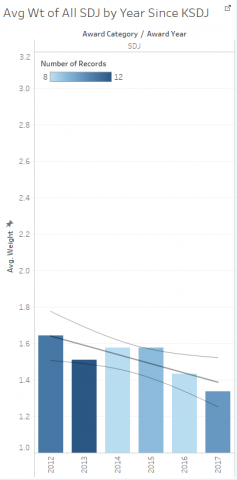
The trend is even more dramatic when looking at the maximum weight of games considered.

Not that the SDJ jurors need any justification for what they do, but this does show that more heavy games were considered, but were losing out to the Medium Light games.
Note: There are only 7 years since the KSDJ, so the data is easily skewed. It will take a few more years to see where the SDJ settles out in the post-KSDJ years.
Round 4: A Special Case
Finally, let’s look at the “Special” awards. Over the years the SDJ jurors have awarded “Special” awards to games that were not otherwise considered for the SDJ award. This practice appears to have stopped since the introduction of the KSDJ. A look at the weight of games given this award provides some insight into their history. Prior to the introduction of the Kennerspiel des Jahres (KDJ) award (the Children’s game), these awards tended to be Light games and the trend was lighter toward 2001 when the KDJ was introduced. Once the KDJ was introduced, the weight of games awarded the Special prize immediately jumped up to KSDJ weight games.
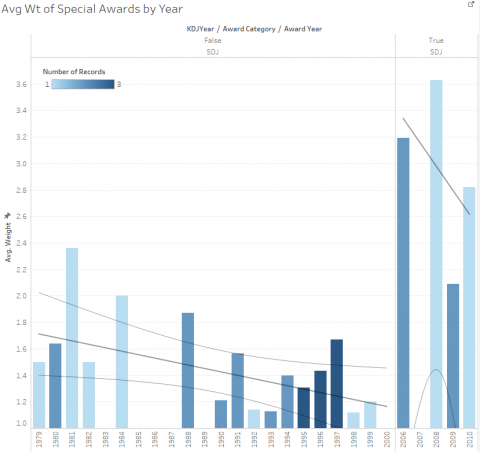
End Game
Although there are no major revelations in this analysis, based on the typical reference to the SDJ as only light games, it is a bit surprising to see the number of weighty games getting some love over the years – even before the KSDJ.
The SDJ jury appears to have responded to the changing tastes of their audience by introducing the Kinderspiel and Kennerspiel at times when the market had broadened for lighter and heavier games
Additional parts to this article are available here:
- Spiel des Jahres & the BGG Community - Part 1
- The Full Weight of the Spiel des Jahres - Part 2
- How do Spiel des Jahres Winners Rate? – Part 3
- Buy and Play Spiel des Jahres Games– Part 4
- What Makes an SDJ Winner? – Part 5
- The Impact of SDJ Consideration – Part 6
Your Turn
Do you ever use the BGG weight as a factor in deciding whether you are interested in a game? What is the typical weight of the games you like to play? Are that SDJ and KSDJ game weights surprising to you? Have you considered these awards in you game buying and playing interest? Does the data change your mind about your reliance on them?
Flavor Text
This is the data that I was originally collecting to analyze, so it is the best place to start. However, as I started digging into the data, I saw other factors that may provide interesting analysis and possible insight into these prestigious awards.
How do Spiel des Jahres Winners Rate? – Part 3
Setup
Considering the statement made in Part 1 regarding the relevance of the SDJ to the BGG audience, let’s take a look at how the games considered for the SDJ rate on BGG. This rating begins with the Average User Rating, which drives the BGG Rating (which considers the number of User Ratings), and ultimately the BGG Rank (which stacks the BGG Ratings up against each other). Although, BGG Rank is ultimately the most interesting and will have the greatest focus in this article, we will look at some statistics about the SDJ and KSDJ games in the order that the BGG Rank is built: User Rating –> BGG Rating –> BGG Rank. All graphs have been derived from data obtained from BoardGameGeek.com in June and July 2017.
Note: If you are starting your reading with this article, you might want to jump to the introduction here: Industry Focus: Spiel des Jahres & the BGG Community Part 1
Round 1: User Rating
Are the SDJ and KSDJ games the kind of games that BGG users want to play? Let’s take a look at the User Ratings to get an idea. Unfortunately, I have no way to calculate Average User Ratings across the population of BGG listed games for comparison, so this analysis is a bit subjective – how do these games rate against expectations (vs. other games).
First let’s look at the games by Award Category.
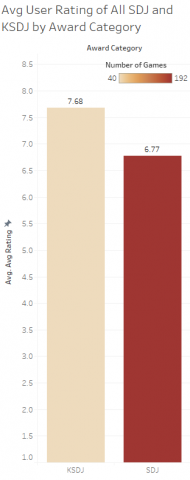
Probably no real surprise here, but maybe they all rate higher with the BGG users on average than one might expect. The KSDJ games rate better on average than the lighter, SDJ games by about a full point (precisely 0.91).
Now let’s break that out into how the games fare within the awards, what I have called the Award Level.
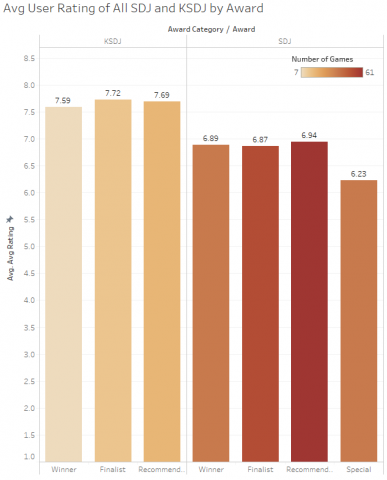
There is not a great distinction among BGG Users for the games mentioned for the awards. For the KSDJ, there is a slight preference for the games that were not the Winners. This is in line with popular opinion that the awards highlight games that are less strategic than the average BGG user wants. Though, the difference is not great, we will see more of this later.
Now the average User Ratings of all games mentioned in the awards by Award Category by year.
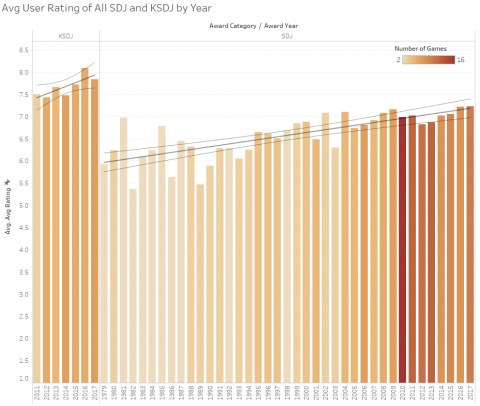
Not surprising, the KSDJ games as a group rate higher than the SDJ games and there is a general rise in rating over time for both Award Categories. The average rating for the KSDJ games in the high 7’s is quite good and the SDJ rising steadily from 6 to 7 is respectable, but not fantastic. However, since these are averages of up to 16 games, there could be some real gems hidden in all the dross. Here are the best User Ratings in each.
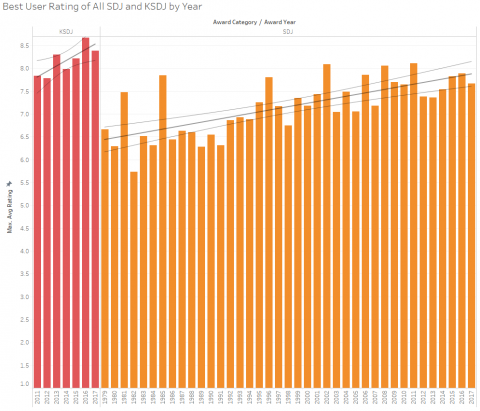
No surprise here. The best rated games are about a half point higher than the average for each year.
Finally, the ratings trend of the Winners only is not too different from the “best” ratings, so apparently the judges generally get it right… (except Pandemic Legacy: Season 1).
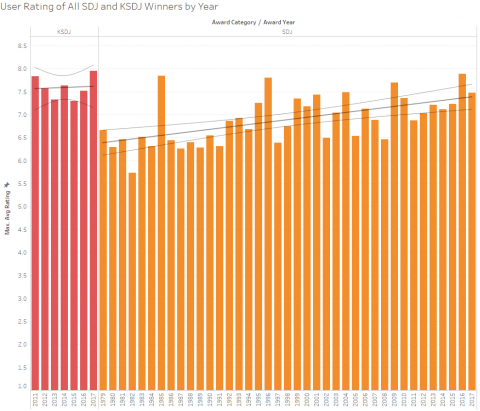
Round 2: BGG Rating
The BGG rating is derived from the Average User Rating with the addition of a factor to account for number of ratings. This is to prevent a game that only has a few very high ratings from shooting up the ranking and is presumably done by seeding the calculation with some number of low or middle ratings as a buffer. I believe that the exact formula is still a mystery, but I suspect that a base rating of about 5.5 for 1000-2000 “users”. There is also a minimum number of User Ratings required for a BGG Rating to be calculated – this helps obfuscate the formula.
These charts should not differ drastically from the User Rating charts except for games that have had limited distribution. It is curious to note that a low rated game with few ratings will actually benefit from the BGG Rating calculation; though, very few of the games in this study meet those criteria. Here are the same trends that were presented for User Ratings with BGG Ratings.
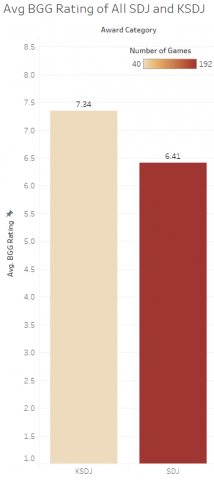
Again, the difference here between the two Award Categories is about a full point (precisely 0.93 – a tiny bit, 0.02 greater than the user ratings). The total difference from the User Ratings to the BGG Ratings is a drop of 0.34 points. This indicates that as a group (not individual games), the BGG calculation for ratings is keeping ratings in check, but not causing a great relative difference.
Now, breaking these out into the Award Level.
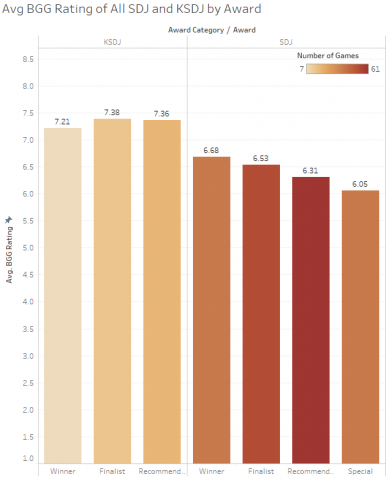
Again, other than the 0.34 point drop, there is no significant difference from the average User Ratings. The SDJ Award Level popularity is a little shuffled from the raw User Rating and thre is a small but noticeable decrease in the popularity of the SDJ games as they drop in Award Level.
Now a few charts by year.
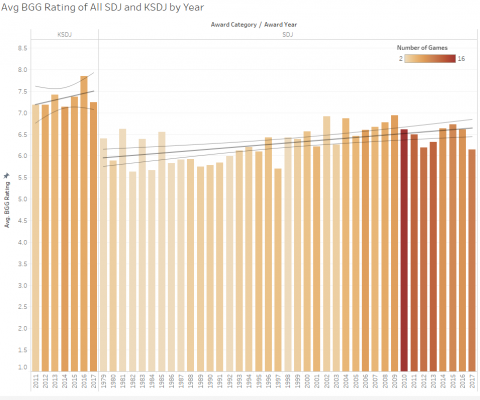
Not much to note for the total population of games here, but (comparing to the same graph for User Ratings) the BGG Ratings process has caused a slight leveling as expected.
Now, the best of the best.
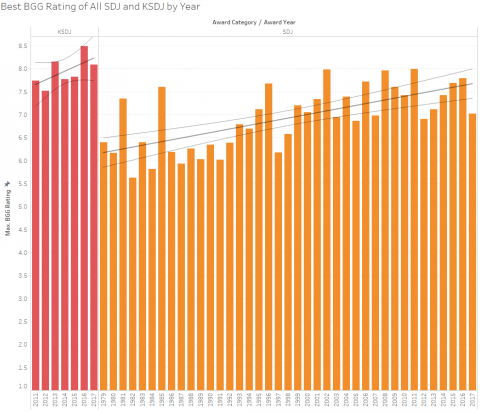
Similar to the User Ratings, we see greater discrepancies per year (we aren’t leveling by averaging) and the rise over the years is more drastic. This might suggest that the judges are still considering a broad range of games, including some that have a global appeal and some that are specific to the German market.
And, finally, just the Winners.
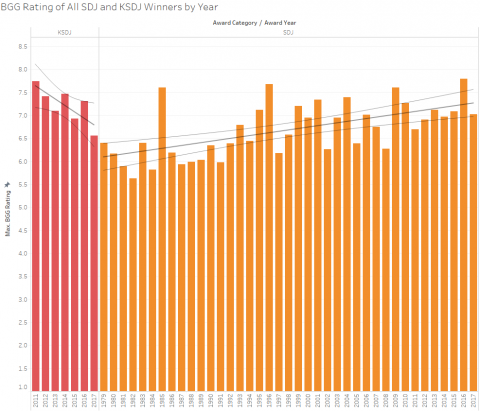
Due to the small number of data points for the KSDJ, the trend shows a drastic change, but the actual difference is primarily the change in the rating for the 2017 game (really a game system) EXIT: Das Spiel, which had limited distribution at this time and so had comparatively very few ratings.
We will look at the Special awards separately as well, since the nature of the award has changed over the years.
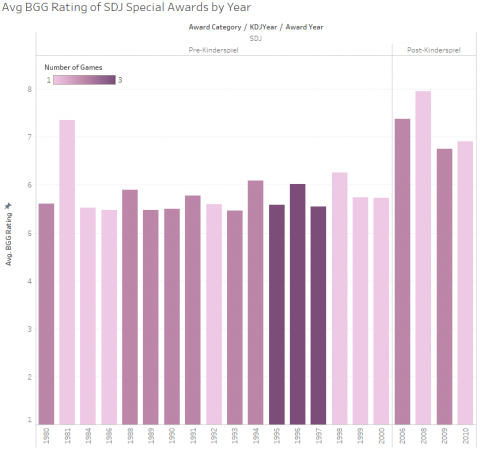
As with the comparisons for game weight in Part 2, we see two different eras of the “Special” Award. With the exception of 1981, when Ra was honored, the Special Award was primarily used to acknowledge lighter, children’s games until the inception of the Kinderspiel Award in 2001. In the four years that the award has been given leading up to 2011 when the Kennerspiel Award was implemented, the award was used to acknowledge heavier games:
- 2006: Caylus, Shadows Over Camelot
- 2008: Agricola
- 2009: GifTRAP (the exception), Space Alert
- 2010: World Without End
Round 3: BGG Rank
The BGG Rank is determined by simply sorting the games by their BGG Rating. Although, this is essentially the same statistic as discussed in Round 2, it has a different effect on the brain so we will take a look at these statistics from a different angle. This is the angle that we will focus most of our attention and rather than focusing on “average rank” which quickly becomes muddy, I have created a few Ranking categories that were convenient mathematically, but also can be described:
- Top 50: These are the “best of the best.”
- 51-200: These are great games.
- 201-500: Many of these were once great games, but have not aged as well as some.
- 500-1000: These get played a lot.
- 1000-2000: OK, but still get played occasionally.
- >2000: Generally forgettable.
A couple notes about my categories:
- Although, this splits the Top 100 that are the basis for the BGG Rankings home page across 2 categories, with the number of high quality games these days, a lot of great games fall into the 101-200 range.
- For perspective, BGG has over 28,000 games listed, so the cut-off at 2000 represents the top 7% of all games listed.
SDJ Considered Games
First, let’s look at the SDJ games (excluding KSDJ) categorized by their position in the awards, the Award Level, and where they rank on BGG. The percentage represents the number of games in that BGG ranking category as a percentage of the games in the Award Level (E.G., All the red “Winners” add up to 100%).
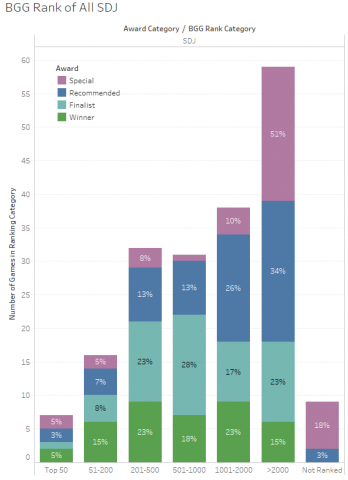
The Winners do tend to rank a little higher than the other games considered for the award – about 20% in the Top 200 vs. about 10% for the other considered games. Here is a look, zeroing in on just the Winners.
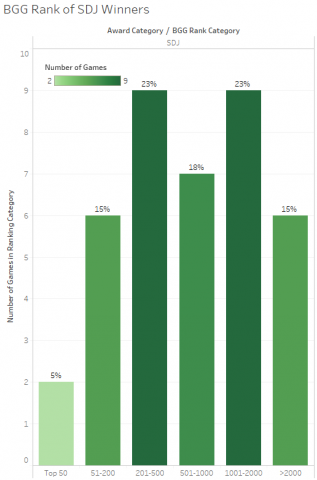
Only 6 of the 39 games are not in the Top 2000, which is a pretty good place to be. For reference, on Jan 16, 2018 these were the rankings around 2000: (a mix of decent strategy games and respected family games)
- 1997 - The Witcher Adventure Game
- 1998 - Pairs
- 1999 - Subdivision
- 2000 - Slide 5
KSDJ Considered Games
Now let’s look at the KSDJ, which we appropriately suspect will rank higher in general on BGG since they are heavier games as shown in Part 2 of this series.
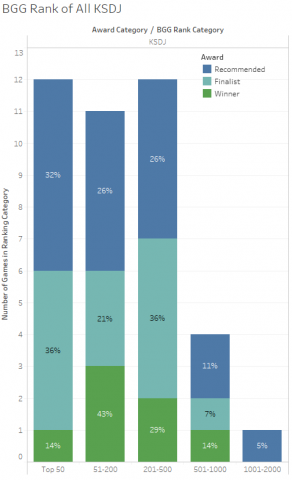
The KSDJ considered games are well represented in the Top 50, with 12 games – that’s almost 25% of the top 50 games in just 7 years of awards – and representing 30% of all games considered for the award. Combine that with the 7 SDJ games and the SDJ awards represent 38% of the Top 50 games on BGG. Not a bad showing. A whopping 88% of all games considered for KSDJ rank in the Top 500 games.
The big difference between the SDJ award and KSDJ Award Categories is the representation of the Winners in comparison to the other games considered. In the SDJ games we saw the Winners lead the way by 2x over all others in the Top 200. For the KSDJ we see almost a dead heat at 57-58% in the Top 200, and the Finalists and Recommended games well ahead in the Top 50.
Round 4: BGG Rank by Year
SDJ Considered Games
Games move up and down the BGG rankings over time, but for the most part, newer games rise and older games slide down. Since the SDJ has been awarded since 1979, there are a lot of “old” games in this collection of SDJ Winners and considered games. Let’s take a look at how well the SDJ games have aged as measured by their BGG ranking.
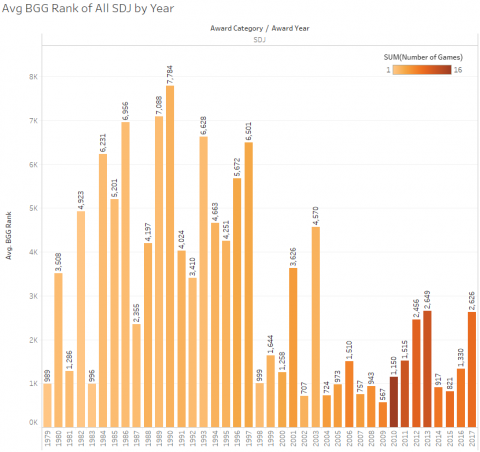
From this graph it appears that some older games have become classics and newer games may not be faring as well as we might expect. As with the comparisons on game weight in Part 2 of this series, it appears that the SDJ games were gaining popularity until the KSDJ was started when there was a slide in the ranking as the SDJ was awarded to very light games and the KSDJ replaced the honors for heavier games. Note: The results for 2017 were captured right at the time the award was announced so we will see in a later article if the ranking improves with the familiarity promoted by the award itself. Note: There are a few games over the years that are not ranked at all (9 of the 238 games in the survey), so these have been removed for the purpose of calculating an average and may have affected the results for specific years. (EX: There were 2 games in 1979, one ranked 989 and the other not ranked).
Narrowing this down to just the Winners each year, we get a better picture of how the award ranks when the obscure family games that never break out of just the German market are removed.
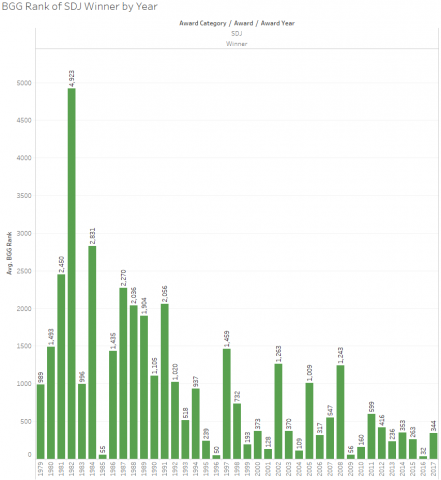
Finally, the rest of the SDJ considered games by Award Level.
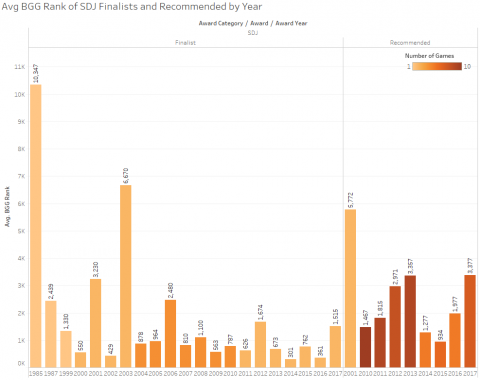
Again, let’s look at the Special awards separately, since the nature of the award has changed over the years.
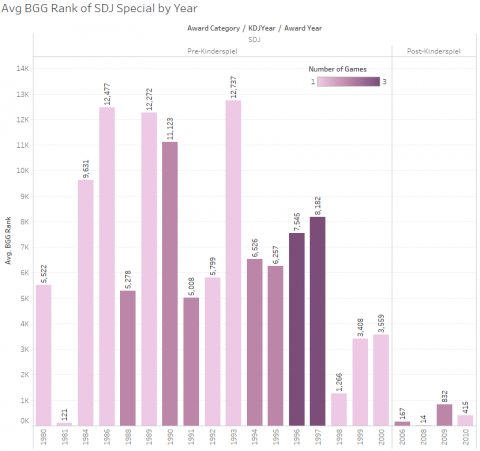
Now let’s ignore the Award Level and look at the best games of all considered by year.
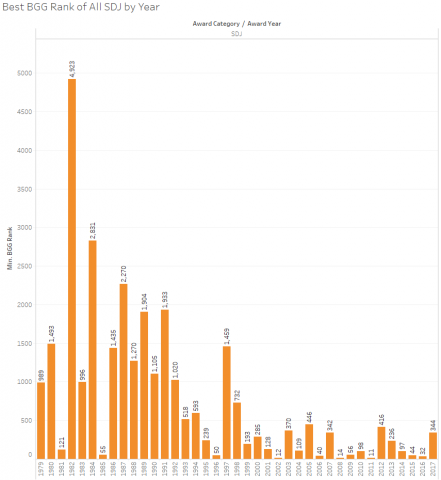
Again, we see a few classics represented and, not surprisingly, newer games generally rank higher.
KSDJ Considered Games
Now on to the KSDJ data. Since the KSDJ has been around for only 7 years it is easy enough to look at the average rank by year and award level. Here is what the highest KSDJ games by year looks like.
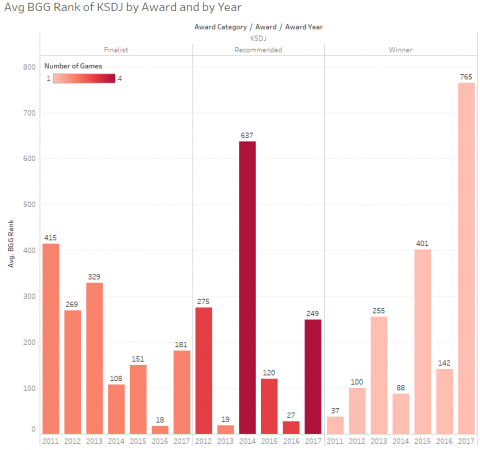
As we saw earlier with the aggregate results by Award Level, the Finalists and Recommended games fare at least as well as the Winners of the KSDJ. 2016 appears to be a particularly good year.
Again, let’s look at the best of the best, the highest ranked KSDJ games by year.
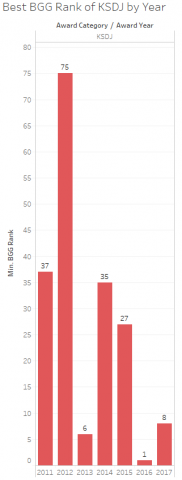
End Game
The SDJ and, in particular, the KSDJ games are well respected on BGG and for a small percentage of all games on the site, have claimed high awards in the BGG ranking. While there is definitely a mixed bag of results, the awards represent what the judges believe to be the best family games for a very specific market, but manage to garner wide attention.
Chicken or the Egg?
Which comes first, the quality that appeals to both the BGG audience and the SDJ judges or a BGG ranking that follows the placement of the awards? Note: this would be really difficult to explore since many of the games have no audience outside Germany until after they are recognized by the SDJ and then gain international distribution. However, in our final article to this series, we will compare the ratings of the 2017 SDJ and KSDJ games at the time the awards were announced to their ratings several months later.
Additional parts to this article are available here:
- Spiel des Jahres & the BGG Community - Part 1
- The Full Weight of the Spiel des Jahres - Part 2
- How do Spiel des Jahres Winners Rate? – Part 3
- Buy and Play Spiel des Jahres Games– Part 4
- What Makes an SDJ Winner? – Part 5
- The Impact of SDJ Consideration – Part 6
Your Turn
Flavor Text
I would really like to see how these numbers compare to the complete list of games in BGG, particularly breaking it down by year produced, but there is no way for me to accomplish that (without full access to the BGG database).
A note about the charts: While the differences in the ratings are generally at the top of the chart, I intentionally kept the Y-Axis to the origin to show how those differences are relatively small compared to the scale.
Note: Although this part of the article series wasn’t published until January 2018, the data was collected in June 2017.