
Hobby Game Trends 2000-2014 Round 2: Game Releases
Annual New Releases
Before we can begin evaluating any particular subset of games released (by category, genre, mechanic, etc.), we first need to establish a baseline for total games released.
At a Glance
It is no secret that the number of games released annually is increasing. Every measure I have heard is increasing - the number of games released: at Essen Spiel, at Gen Con, through Kickstarter, etc. So this analysis may not provide any surprises or insights, but is necessary to establish the baseline for all other release statistics.
The desire here is to focus on the “hobby games” industry, but in the BGG database differentiating the data for mass market games vs. hobby games is not direct. Ultimately, I can narrow my focus in some ways, but not others. Hopefully, the end result is indicative of the market I am trying to represent.
The Data
All Games
First, a look at all (as recorded in BGG) games released in the years 2000-2014. These numbers include expansions and promos – if there is a record in BGG, it is included – which may bias the data. Since I am concentrating on trends over what has happened in a particular year, I will also present a 3-year running average here and will use this method for most comparisons.
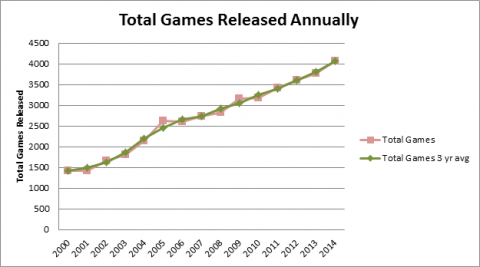
The increase in the number of games released appears to be fairly linear over the entire range, but particularly over the last 7 years.
Hobby Games
As stated, the object of this analysis is “hobby games,” but the ability to focus on this market is limited. So, a few specific game categories that are fairly exact will be eliminated from the data while a greater volume of games will have to remain due to their inexact classification. Note: A complete survey of the BGG categorization of games follows in another article.
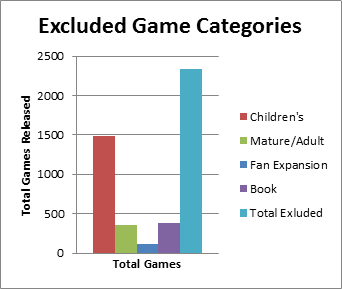
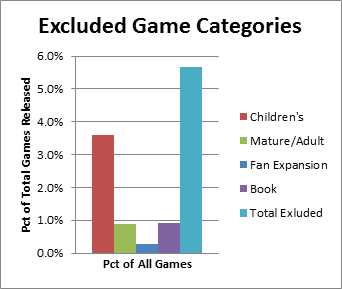
Please don’t think less of me, but I will combine Children’s games and Mature/Adult games into the category of games that can be removed from this study. I am sure that Children’s games will make a very interesting study, but it is not my current focus. Also removed from the data are “Books” and “Fan Expansions” categories which don’t really represent published games. Combined, these categories represent a small percentage of the total games, so the improvement to the data is also small. However, several of the categories intended to study are even smaller. Of games released 2000-2014, these are the numbers:
“But wait!” you say, “What about Cards Against Humanity?” Yes, excluding the Mature/Adult category removes Cards Against Humanity from the data and 29 other BGG ranked games. The other 328 games that are eliminated are, shall we say, lesser known. In general these games are not in the Hobby Games class.
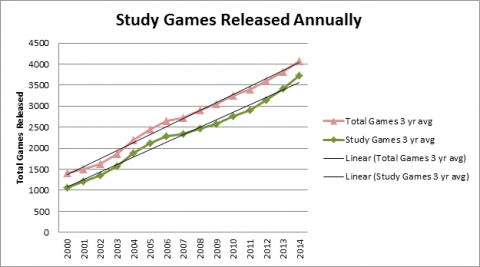
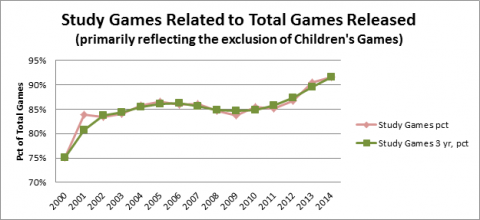
Eliminating these categories produces the illustrated trend. The trend for what I will call the Study Games is not greatly different from the trend for all games, but there appears to be a steeper rise in new games in recent years which may be significant.
Looking at the difference in the two trends is enlightening. The percentage of non-Children’s games released has increased significantly (from 75% to 92%) over the last 15 years. Though, the increase has not come linearly. A sharp increase in the early 2000’s was followed by a period of relative stability or slight decline, then followed by another sharp increase. Is the trend going to cycle again or is it now on a clear, continual upward path? The actual data for 2014 indicates that the curve may be flattening again, but one point does not a trend make. With the percentage already at 92% however, there is not much more room for growth.
Note: The difference is measured between the actual data for each year then the 3 year average is calculated from the result.
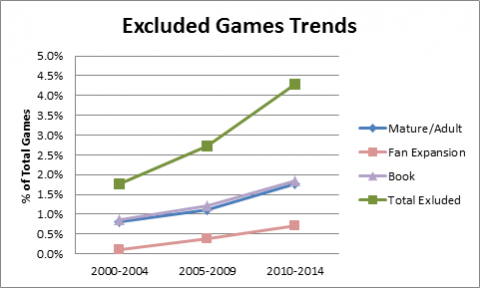
Without providing detailed numbers here are some thoughts. Fan Expansions, Books, and Mature/Adult game releases all have increased over the last 15 years and increased faster as a percentage of all games released in recent years. Excluding them would tend to drive down the recent increase for the Study Games list. Since 64% of the games removed from the study are Children’s games, and the other excluded games have increased, new Children’s games releases have probably declined. There may be an interesting study regarding the trends for those games. Unfortunately, “Children’s Games” in BGG is spread out over a Category and a Subdomain that overlap partially making analysis more complicated and effort than desired at this point.
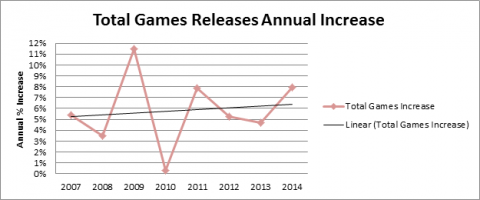
Turning to the rate of increase in games releases, the data is striking. There appears to have been a boom in the early 2000s followed by a reset in 2006 with the years since being fairly flat.
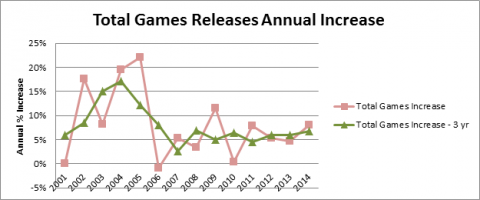
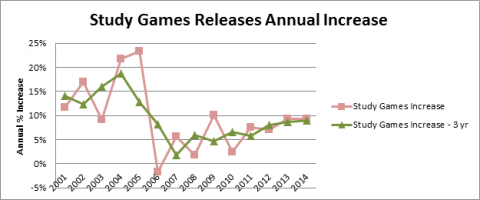
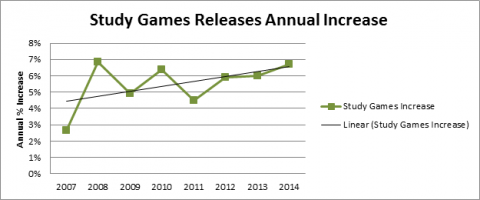
The trend for the Study Games is very similar with the rise over the last few years still evident. In both sets of data there is only one year, 2006, where the rate of increase dropped below 0 (the rate of releases actually decreased) and this was small.
The average increase in growth rate for all games from 2007 to 2014 was from about 5.4% to about 6.2% - a growth rate increase of about 0.1% per year.
The average increase in growth rate for the Study Games from 2007 to 2014 was from about 4.4% to about 6.6% - a growth rate increase of about 0.2% per year.
2015 Games Announced
Although at the time this data was acquired in early January 2015, taking a peek at games already listed as 2015 publications provides some insight into the data. The database likely includes a date when the record was created, but that data is not available through the search engine. The data collected to demonstrate what can be derived from forecasting game releases is dependent on research that has not been released yet, so I will revisit this in the near future.
Conclusions
All Games Releases
It comes as no surprise that the number of games released each year has been increasing every year. What may come as a surprise is that the rate of increase is fairly flat for the last 8 years. Anecdotal accounts indicate that the rate has been increasing significantly in the last few years. The Study Games trend shows at least a slight rise in recent years, but neither indicates that the industry is on the leading edge of a boom.
Hobby Games Releases
While I am primarily interested in “Hobby Games,” I will try to be specific when I think I am getting closer to that specific class of games. I will usually refer to this list as the Study Games since unfortunately I cannot be so specific. Even so, the increase of Study Games (non-Children’s Games) as a percentage of total games released indicates an increase in the releases of Hobby Games over the last 15 years and at an increasing rate in the last 4 years.
If the Study Games can be assumed to represent Hobby Games, there are a few trends worth noting. As with all games, Hobby Games are increasing in production but at a higher rate than the industry over all. Although there are many new sources for games releases (small publishers and Kickstarter) the total new games being introduced is increasing at a fairly flat rate.
New Game Announcements and Projections
Although the data has not been represented yet, it is important to report the following at this point. The 2015 data indicates that on BGG hobby games are announced and records are generally created as soon as they meet the BGG qualifications while mass market games are recorded after they are in market as a matter of historical accuracy. This difference in documentation methods may skew data for recent years; some hobby games projected for 2014 release may not have made it into market and recently released mass market games may not have been recorded. The best correction I can propose is to compare statistics gathered in 2014 with those gathered at the same time in 2015 and 2016 for comparison. So we will have to wait for that analysis.